
Page 102 - Academic Press Encyclopedia of Physical Science and Technology 3rd BioTechnology
P. 102
P1: GNB Final Pages
Encyclopedia of Physical Science and Technology EN005F-954 June 15, 2001 20:48
Fiber-Optic Chemical Sensors 815
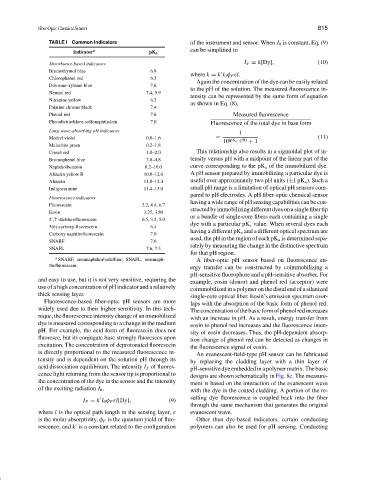
TABLE I Common Indicators of the instrument and sensor. When I 0 is constant, Eq. (9)
Indicator a pK a can be simplified to
Absorbance-based indicators I F = k[Dy], (10)
Bromothymol blue 6.8
where k = k I 0 φ F εl.
Chlorophenol red 6.3
Again the concentration of the dye can be easily related
Dibromo-xylenol blue 7.6
to the pH of the solution. The measured fluorescence in-
Neutral red 7.4, 5.9
tensity can be represented by the same form of equation
Nitrazine yellow 6.5
as shown in Eq. (8),
Palatine chrome black 7.4
Phenol red 7.6 Measured fluorescence
Phenoltetrachloro-sulfonaphthalein 7.0 Fluorescence of the total dye in base form
Long-wave-absorbing pH indicators
1
Methyl violet 0.0–1.6 = (pK a −pH) . (11)
10 + 1
Malachite green 0.2–1.8
Cresol red 1.0–2.0 This relationship also results in a sigmoidal plot of in-
Bromophenol blue 2.8–4.8 tensity versus pH with a midpoint of the linear part of the
Naphtholbenzein 8.2–10.0 curve corresponding to the pK a of the immobilized dye.
Alizarin yellow R 10.0–12.0 A pH sensor prepared by immobilizing a particular dye is
Alizarin 11.0–12.4 useful over approximately two pH units (±1pK a ). Such a
Indigocarmine 11.4–13.0 small pH range is a limitation of optical pH sensors com-
pared to pH electrodes. A pH fiber-optic chemical sensor
Fluorescence indicators
having a wide range of pH sensing capabilities can be con-
Fluorescein 2.2, 4.4, 6.7
structedbyimmobilizingdifferentdyesonasinglefibertip
Eosin 3.25, 3.80
or a bundle of single-core fibers each containing a single
2 ,7 -dichlorofluorescein 0.5, 3.5, 5.0
dye with a particular pK a value. When several dyes each
5(6)-carboxy-fluorescein 6.4
having a different pK a and a different optical spectrum are
Carboxy naphthofluorescein 7.0
used, the pH in the region of each pK a is determined sepa-
SNARF 7.6
rately by measuring the change in the distinctive spectrum
SNAFL 7.6, 7.3
for that pH region.
a SNARF, seminaphthorhodafluor; SNAFL, seminaph- A fiber-optic pH sensor based on fluorescence en-
thofluorescein. ergy transfer can be constructed by coimmobilizing a
pH-sensitive fluorophore and a pH-sensitive absorber. For
and easy to use, but it is not very sensitive, requiring the example, eosin (donor) and phenol red (acceptor) were
use of a high concentration of pH indicator and a relatively coimmobilized in a polymer on the distal end of a silanized
thick sensing layer. single-core optical fiber. Eosin’s emission spectrum over-
Fluorescence-based fiber-optic pH sensors are more
laps with the absorption of the basic form of phenol red.
widely used due to their higher sensitivity. In this tech-
Theconcentrationofthebasicformofphenolredincreases
nique,thefluorescenceintensitychangeofanimmobilized
with an increase in pH. As a result, energy transfer from
dye is measured corresponding to a change in the medium
eosin to phenol red increases and the fluorescence inten-
pH. For example, the acid form of fluorescein does not
sity of eosin decreases. Thus, the pH-dependent absorp-
fluoresce, but its conjugate base strongly fluoresces upon
tion change of phenol red can be detected as changes in
excitation. The concentration of deprotonated fluorescein
the fluorescence signal of eosin.
is directly proportional to the measured fluorescence in-
An evanescent-field-type pH sensor can be fabricated
tensity and is dependent on the solution pH through its
by replacing the cladding layer with a thin layer of
acid dissociation equilibrium. The intensity I F of fluores- pH-sensitive dye embedded in a polymer matrix. The basic
cence light returning from the sensor tip is proportional to designs are shown schematically in Fig. 8c. The measure-
the concentration of the dye in the sensor and the intensity ment is based on the interaction of the evanescent wave
of the exciting radiation I 0 , with the dye in the coated cladding. A portion of the re-
sulting dye fluorescence is coupled back into the fiber
I F = k I 0 φ F εl[Dy], (9)
through the same mechanism that generates the original
where l is the optical path length in the sensing layer, ε evanescent wave.
is the molar absorptivity, φ F is the quantum yield of fluo- Other than dye-based indicators, certain conducting
rescence, and k is a constant related to the configuration polymers can also be used for pH sensing. Conducting