
Page 142 - Academic Press Encyclopedia of Physical Science and Technology 3rd Chemical Engineering
P. 142
P1: ZCK/FLS P2: FYK/FLS QC: FYK Revised Pages
Encyclopedia of Physical Science and Technology EN002G-100 May 19, 2001 18:49
764 Chemical Process Design, Simulation, Optimization, and Operation
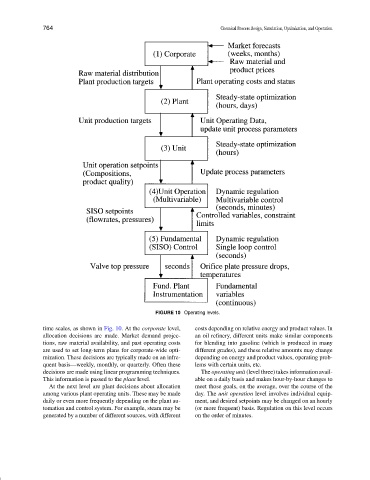
FIGURE 10 Operating levels.
time scales, as shown in Fig. 10. At the corporate level, costs depending on relative energy and product values. In
allocation decisions are made. Market demand projec- an oil refinery, different units make similar components
tions, raw material availability, and past operating costs for blending into gasoline (which is produced in many
are used to set long-term plans for corporate-wide opti- different grades), and these relative amounts may change
mization. These decisions are typically made on an infre- depending on energy and product values, operating prob-
quent basis—weekly, monthly, or quarterly. Often these lems with certain units, etc.
decisions are made using linear programming techniques. The operating unit (level three) takes information avail-
This information is passed to the plant level. able on a daily basis and makes hour-by-hour changes to
At the next level are plant decisions about allocation meet those goals, on the average, over the course of the
among various plant operating units. These may be made day. The unit operation level involves individual equip-
daily or even more frequently depending on the plant au- ment, and desired setpoints may be changed on an hourly
tomation and control system. For example, steam may be (or more frequent) basis. Regulation on this level occurs
generated by a number of different sources, with different on the order of minutes.