
Page 198 - Academic Press Encyclopedia of Physical Science and Technology 3rd Chemical Engineering
P. 198
P1: GAE/LSK P2: FLV Final Pages
Encyclopedia of Physical Science and Technology EN004D-ID159 June 8, 2001 15:47
Crystallization Processes 95
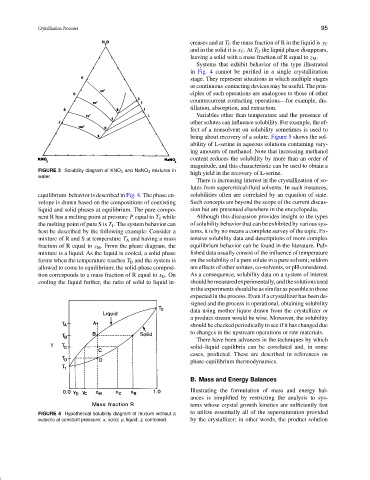
creases and at T C the mass fraction of R in the liquid is y C
and in the solid it is x C .At T D the liquid phase disappears,
leaving a solid with a mass fraction of R equal to z M .
Systems that exhibit behavior of the type illustrated
in Fig. 4 cannot be purified in a single crystallization
stage. They represent situations in which multiple stages
or continuous-contacting devices may be useful. The prin-
ciples of such operations are analogous to those of other
countercurrent contacting operations—for example, dis-
tillation, absorption, and extraction.
Variables other than temperature and the presence of
other solutes can influence solubility. For example, the ef-
fect of a nonsolvent on solubility sometimes is used to
bring about recovery of a solute. Figure 5 shows the sol-
ubility of L-serine in aqueous solutions containing vary-
ing amounts of methanol. Note that increasing methanol
content reduces the solubility by more than an order of
magnitude, and this characteristic can be used to obtain a
FIGURE 3 Solubility diagram of KNO 3 and NaNO 3 mixtures in high yield in the recovery of L-serine.
water.
There is increasing interest in the crystallization of so-
lutes from supercritical-fluid solvents. In such instances,
equilibrium behavior is described in Fig. 4. The phase en- solubilities often are correlated by an equation of state.
velope is drawn based on the compositions of coexisting Such concepts are beyond the scope of the current discus-
liquid and solid phases at equilibrium. The pure compo- sion but are presented elsewhere in the encyclopedia.
nent R has a melting point at pressure P equal to T 2 while Although this discussion provides insight to the types
the melting point of pure S is T 1 . The system behavior can of solubility behavior that can be exhibited by various sys-
best be described by the following example: Consider a tems, it is by no means a complete survey of the topic. Ex-
mixture of R and S at temperature T A and having a mass tensive solubility data and descriptions of more complex
fraction of R equal to z M . From the phase diagram, the equilibrium behavior can be found in the literature. Pub-
mixture is a liquid. As the liquid is cooled, a solid phase lished data usually consist of the influence of temperature
forms when the temperature reaches T B and the system is on the solubility of a pure solute in a pure solvent; seldom
allowed to come to equilibrium; the solid-phase composi- are effects of other solutes, co-solvents, or pH considered.
tion corresponds to a mass fraction of R equal to x B .On As a consequence, solubility data on a system of interest
cooling the liquid further, the ratio of solid to liquid in- should be measured experimentally, and the solutions used
in the experiments should be as similar as possible to those
expected in the process. Even if a crystallizer has been de-
signed and the process is operational, obtaining solubility
data using mother liquor drawn from the crystallizer or
a product stream would be wise. Moreover, the solubility
should be checked periodically to see if it has changed due
to changes in the upstream operations or raw materials.
There have been advances in the techniques by which
solid–liquid equilibria can be correlated and, in some
cases, predicted. These are described in references on
phase-equilibrium thermodynamics.
B. Mass and Energy Balances
Illustrating the formulation of mass and energy bal-
ances is simplified by restricting the analysis to sys-
tems whose crystal growth kinetics are sufficiently fast
FIGURE 4 Hypothetical solubility diagram of mixture without a to utilize essentially all of the supersaturation provided
eutectic at constant pressure: x, solid; y, liquid; z, combined. by the crystallizer; in other words, the product solution