
Page 202 - Academic Press Encyclopedia of Physical Science and Technology 3rd Organic Chemistry
P. 202
P1: LLL/GVX P2: GQT Final Pages
Encyclopedia of Physical Science and Technology EN011G-539 July 14, 2001 21:48
Organic Chemical Systems, Theory 449
Section I, and it is thus easy to see why photochemists which tie thermodynamic quantities such as equilibrium
are more likely than any other organic chemists to discuss constants to rate quantities such as kinetic rate constants:
‡
‡
‡
0
0
chemistry in terms of potential energy surfaces. Further
G −
G = α(
G −
G ), where
G is the free
1 2 1 2
0
discussion of photochemically induced reactions can be energy of activation and
G the free energy of reac-
found below. tion. Perhaps the best known example is the Brønsted law,
which relates equilibrium and kinetic acidity. In general,
linear free energy relationships interrelate changes in free
4. Reaction Coordinate Diagrams
energies or free energies of activation for a series of reac-
Formanypurposesitisusefultocondensethemultidimen- tants, usually differing by substitution. They are useful in
sional complexity of molecular motion from one catch- mechanistic studies.
ment basin to the next into a one-dimensional reaction Cases are also known in which structural perturbations
coordinate diagram in which the degree of progress from act quite differently on the transition state and the product.
the first minimum over the transition state to the second Then, reactions with larger equilibrium constants do not
minimum is plotted horizontally as the so-called reaction necessarily proceed faster than those with smaller ones.
coordinate. The quantity plotted vertically can be the po- Another consequence of a parallel stabilization of a
tential energy E, which we have been discussing so far, product and of the corresponding transition state is the
but then all information that has to do with the properties displacement of the transition structure toward the start-
of the surface along dimensions other than the reaction ing materials along the reaction coordinate (Fig. 7). Those
coordinate is lost. It is more common to plot instead the reactions that obey the Bell–Evans–Polanyi principle thus
Gibbs free energy
G =
H − T
S corresponding to will have earlier transition states relative to other, similar
all degrees of freedom other than the reaction coordinate reactions if they are more favorable thermodynamically
(
H is enthalpy,
S is entropy). In this manner, informa- and a later transition state if they are less favorable. This
tion on the entropic constraints dictated by the shape of statement is known as the Hammond postulate.
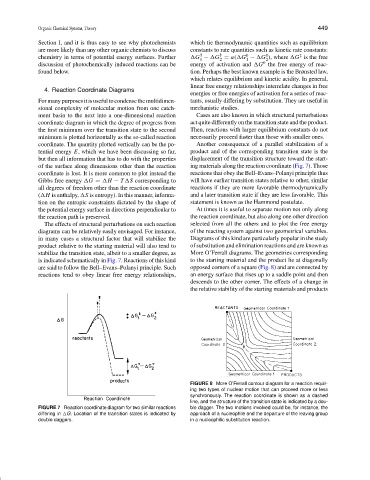
the potential energy surface in directions perpendicular to At times it is useful to separate motion not only along
the reaction path is preserved. the reaction coordinate, but also along one other direction
The effects of structural perturbations on such reaction selected from all the others and to plot the free energy
diagrams can be relatively easily envisaged. For instance, of the reacting system against two geometrical variables.
in many cases a structural factor that will stabilize the Diagrams of this kind are particularly popular in the study
product relative to the starting material will also tend to of substitution and elimination reactions and are known as
stabilize the transition state, albeit to a smaller degree, as More O’Ferrall diagrams. The geometries corresponding
is indicated schematically in Fig. 7. Reactions of this kind to the starting material and the product lie at diagonally
are said to follow the Bell–Evans–Polanyi principle. Such opposed corners of a square (Fig. 8) and are connected by
reactions tend to obey linear free energy relationships, an energy surface that rises up to a saddle point and then
descends to the other corner. The effects of a change in
the relative stability of the starting materials and products
FIGURE 8 More O’Ferrall contour diagram for a reaction requir-
ing two types of nuclear motion that can proceed more or less
synchronously. The reaction coordinate is shown as a dashed
line, and the structure of the transition state is indicated by a dou-
FIGURE 7 Reaction coordinate diagram for two similar reactions ble dagger. The two motions involved could be, for instance, the
differing in
G. Location of the transition states is indicated by approach of a nucleophile and the departure of the leaving group
double daggers. in a nucleophilic substitution reaction.