
Page 169 - Academic Press Encyclopedia of Physical Science and Technology 3rd Analytical Chemistry
P. 169
P1: GQT Final
Encyclopedia of Physical Science and Technology EN006F-275 June 29, 2001 21:12
460 Gas Chromatography
chromatographic peak. This number is simply calculated The column efficiency N can be dependent on a number
from the measured retention distance t R (in length units) of variables. Most importantly, the plate height is shown
and the peak width at the peak half-height W 1/2 : to be a function of the linear gas velocity u according to
the van Deemter equation:
2
t R
N = 5.54 . (8) B
w 1/2 H = A + + Cu, (10)
u
The length of a chromatogrphic column L is viewed as
where the constant A describes the chromatographic band
divided into imaginary volume units (plates) in which a
dispersion caused by the gas-flow irregularities in the col-
complete equilibrium of the solute between the two phases
umn. The B-term represents the peak dispersion due to
is attained. Obviously, for a given value of t R , narrower
the diffusion processes occurring longitudinally inside the
peaks provide greater numbers of theoretical plates than
column, and the C-term is due to a flow-dependent lack
broader peaks. Turning once again to Fig. 3, we see that
of the instantaneous equilibrium of solute molecules be-
cases (a) and (b) represent low column efficiencies (plate
tween the gas and the stationary phase. The mass transfer
numbers), while case (c) demonstrates a high-efficiency
between the two phases occurs due to a radial diffusion of
separation.
the solute molecules.
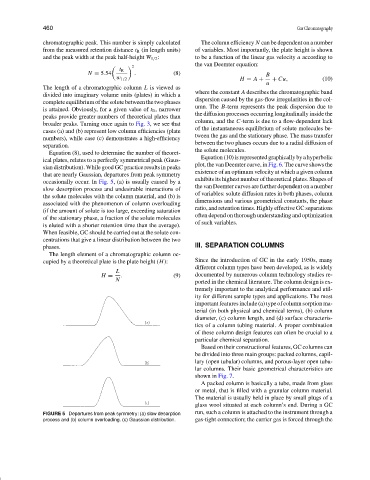
Equation (8), used to determine the number of theoret-
Equation(10)isrepresentedgraphicallybyahyperbolic
ical plates, relates to a perfectly symmetrical peak (Gaus-
plot, the van Deemter curve, in Fig. 6. The curve shows the
sian distribution). While good GC practice results in peaks
existence of an optimum velocity at which a given column
that are nearly Gaussian, departures from peak symmetry
exhibits its highest number of theoretical plates. Shapes of
occasionally occur. In Fig. 5, (a) is usually caused by a
the van Deemter curves are further dependent on a number
slow desorption process and undesirable interactions of
of variables: solute diffusion rates in both phases, column
the solute molecules with the column material, and (b) is
dimensions and various geometrical constants, the phase
associated with the phenomenon of column overloading
ratio, and retention times. Highly effective GC separations
(if the amount of solute is too large, exceeding saturation
often depend on thorough understanding and optimization
of the stationary phase, a fraction of the solute molecules
of such variables.
is eluted with a shorter retention time than the average).
When feasible, GC should be carried out at the solute con-
centrations that give a linear distribution between the two
phases. III. SEPARATION COLUMNS
The length element of a chromatographic column oc-
cupied by a theoretical plate is the plate height (H): Since the introduction of GC in the early 1950s, many
different column types have been developed, as is widely
L
H = . (9) documented by numerous column technology studies re-
N ported in the chemical literature. The column design is ex-
tremely important to the analytical performance and util-
ity for different sample types and applications. The most
important features include (a) type of column sorption ma-
terial (in both physical and chemical terms), (b) column
diameter, (c) column length, and (d) surface characteris-
tics of a column tubing material. A proper combination
of these column design features can often be crucial to a
particular chemical separation.
Based on their constructional features, GC columns can
be divided into three main groups: packed columns, capil-
lary (open tubular) columns, and porous-layer open tubu-
lar columns. Their basic geometrical characteristics are
shown in Fig. 7.
A packed column is basically a tube, made from glass
or metal, that is filled with a granular column material.
The material is usually held in place by small plugs of a
glass wool situated at each column’s end. During a GC
FIGURE 5 Departures from peak symmetry: (a) slow desorption run, such a column is attached to the instrument through a
process and (b) column overloading. (c) Gaussian distribution. gas-tight connection; the carrier gas is forced through the