
Page 19 - Academic Press Encyclopedia of Physical Science and Technology 3rd Analytical Chemistry
P. 19
P1: GJB Revised Pages
Encyclopedia of Physical Science and Technology En001f25 May 7, 2001 13:58
558 Analytical Chemistry
quantum yield, which represents the ratio of energy re-
leased by radiative processes compared with total energy
absorption. Ideally, the quantum yield would have a value
of unity, but molecular interactions such as intermolec-
ular collisions or intramolecular rotations in the sample
matrix can reduce this dramatically. The fluorescent in-
tensity F is therefore a function of the chemical structure
of chromophores and molecular interactions and, for di-
lute solutions with A < 0.05, can be written as
F = 2.3KAP 0 ,
where K is dependent on the quantum yield, A is ab-
sorbance, and P 0 is the incident radiation power. The in-
strumental components of a spectrofluorimeter are very
similar to those for the molecular absorbance technique
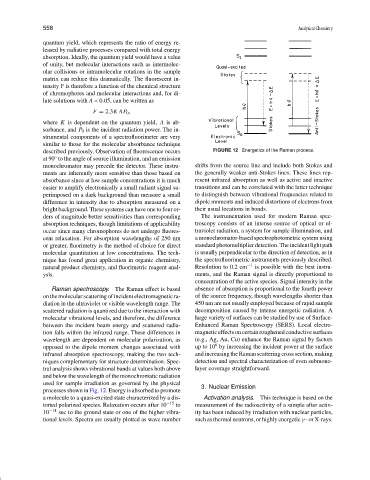
described previously. Observation of fluorescence occurs FIGURE 12 Energetics of the Raman process.
◦
at 90 to the angle of source illumination, and an emission
monochromator may precede the detector. These instru- shifts from the source line and include both Stokes and
ments are inherently more sensitive than those based on the generally weaker anti-Stokes lines. These lines rep-
absorbance since at low sample concentrations it is much resent infrared absorption as well as active and inactive
easier to amplify electronically a small radiant signal su- transitions and can be correlated with the latter technique
perimposed on a dark background than measure a small to distinguish between vibrational frequencies related to
difference in intensity due to absorption measured on a dipole moments and induced distortions of electrons from
bright background. These systems can have one to four or- their usual locations in bonds.
ders of magnitude better sensitivities than corresponding The instrumentation used for modern Raman spec-
absorption techniques, though limitations of applicability troscopy consists of an intense source of optical or ul-
occur since many chromophores do not undergo fluores- traviolet radiation, a system for sample illumination, and
cent relaxation. For absorption wavelengths of 250 nm a monochromator-based spectrophotometric system using
or greater, fluorimetry is the method of choice for direct standard photomultiplier detection. The incident light path
molecular quantitation at low concentrations. The tech- is usually perpendicular to the direction of detection, as in
nique has found great application in organic chemistry, the spectrofluorimetric instruments previously described.
natural product chemistry, and fluorimetric reagent anal- Resolution to 0.2 cm −1 is possible with the best instru-
ysis. ments, and the Raman signal is directly proportional to
concentration of the active species. Signal intensity in the
Raman spectroscopy. The Raman effect is based absence of absorption is proportional to the fourth power
on the molecular scattering of incident electromagnetic ra- of the source frequency, though wavelengths shorter than
diation in the ultraviolet or visible wavelength range. The 450 nm are not usually employed because of rapid sample
scattered radiation is quantized due to the interaction with decomposition caused by intense energetic radiation. A
molecular vibrational levels, and therefore, the difference large variety of surfaces can be studied by use of Surface-
between the incident beam energy and scattered radia- Enhanced Raman Spectroscopy (SERS). Local electro-
tion falls within the infrared range. These differences in magnetic effects on certain roughened conductive surfaces
wavelength are dependent on molecular polarization, as (e.g., Ag, Au, Cu) enhance the Raman signal by factors
6
opposed to the dipole moment changes associated with up to 10 by increasing the incident power at the surface
infrared absorption spectroscopy, making the two tech- and increasing the Raman scattering cross section, making
niques complementary for structure determination. Spec- detection and spectral characterization of even submono-
tral analysis shows vibrational bands at values both above layer coverage straightforward.
and below the wavelength of the monochromatic radiation
used for sample irradiation as governed by the physical
3. Nuclear Emission
processes shown in Fig. 12. Energy is absorbed to promote
a molecule to a quasi-excited state characterized by a dis- Activation analysis. This technique is based on the
torted polarized species. Relaxation occurs after 10 −15 to measurement of the radioactivity of a sample after activ-
10 −14 sec to the ground state or one of the higher vibra- ity has been induced by irradiation with nuclear particles,
tional levels. Spectra are usually plotted as wave number such as thermal neutrons, or highly energetic γ - or X-rays.