
Page 21 - Academic Press Encyclopedia of Physical Science and Technology 3rd Analytical Chemistry
P. 21
P1: GJB Revised Pages
Encyclopedia of Physical Science and Technology En001f25 May 7, 2001 13:58
560 Analytical Chemistry
Stationary phases can be solid surfaces or surfaces rate at which equilibrium is attained include the volume
coated with liquids, while mobile phases can be liquids or and average thickness of the liquid stationary phase and
gases. Standard forms that stationary phases take are often diffusion coefficients and relative equilibrium concentra-
very fine granular powders spread evenly on planar glass tion ratios of the mobile and stationary phases.
or polymer supports (e.g., thin-layer chromatography) or A feature of fundamental interest for any chromato-
packed in columns. Also common are porous polymeric graphic work is the resolution or separation capability of
solids usually containing a microcoating of water (liquid the technique. One equation useful for quantitative mea-
stationary phase) or capillary tubes whose inside walls are surement of resolution R can be written
coated with a liquid stationary phase.
Thetheoryofchromatographyhasbeenreasonablywell R = 2 Z/(W 1 + W 2 ),
established with a “kinetic” or “rate” theory that describes
where W 1 and W 2 represent the base width of two different
the broadening of the bands or zones of separated com-
peaks in a separation and Z represents the difference in
ponents on a stationary-phase bed, describes their time
elution of the maxima of the two peaks.
of appearance at any particular point, and provides de-
tails of the separation power or resolution of the particular
system employed. Numerous equations describing zone 2. Gas Chromatography
broadening have been proposed, the simplest being the
general form of the van Deemter equation as derived for This technique is one of the cornerstones of chromato-
gas–liquid chromatography, graphic analysis, being suitable for the separation of very
complex organic and inorganic gas samples. The mobile
H = A + B/V + Cv, phase is a carrier gas chosen to maximize separation ef-
where A, B, C represent three kinetically controlled pro- ficiency as per the van Deemter equation, while concur-
cesses known as eddy diffusion, longitudinal diffusion, rently maximizing the sensitivity of the detector. The sta-
and nonequilibrium mass transfer, respectively. The term tionary phase is either a solid or a viscous organic liquid
v represents the mobile-phase flow rate, and H is defined coated on a solid support (hundreds available) or an open
as the height equivalent of a theoretical plate. This ter- tubular capillary column (for very high efficiency separa-
minology derives from the plate theory of distillations, tions).
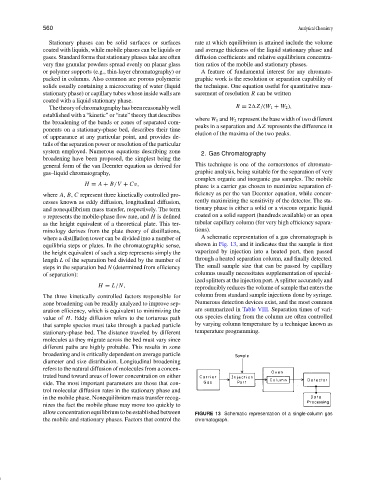
where a distillation tower can be divided into a number of A schematic representation of a gas chromatograph is
equilibria steps or plates. In the chromatographic sense, shown in Fig. 13, and it indicates that the sample is first
the height equivalent of such a step represents simply the vaporized by injection into a heated port, then passed
length L of the separation bed divided by the number of through a heated separation column, and finally detected.
steps in the separation bed N (determined from efficiency The small sample size that can be passed by capillary
of separation): columns usually necessitates supplementation of special-
ized splitters at the injection port. A splitter accurately and
H = L/N,
reproducibly reduces the volume of sample that enters the
The three kinetically controlled factors responsible for column from standard sample injections done by syringe.
zone broadening can be readily analyzed to improve sep- Numerous detection devices exist, and the most common
aration efficiency, which is equivalent to minimizing the are summarized in Table VIII. Separation times of vari-
value of H. Eddy diffusion refers to the torturous path ous species eluting from the column are often controlled
that sample species must take through a packed particle by varying column temperature by a technique known as
stationary-phase bed. The distance traveled by different temperature programming.
molecules as they migrate across the bed must vary since
different paths are highly probable. This results in zone
broadening and is critically dependent on average particle
diameter and size distribution. Longitudinal broadening
refers to the natural diffusion of molecules from a concen-
trated band toward areas of lower concentration on either
side. The most important parameters are those that con-
trol molecular diffusion rates in the stationary phase and
in the mobile phase. Nonequilibrium mass transfer recog-
nizes the fact the mobile phase may move too quickly to
allow concentration equilibrium to be established between FIGURE 13 Schematic representation of a single-column gas
the mobile and stationary phases. Factors that control the chromatograph.