
Page 26 - Academic Press Encyclopedia of Physical Science and Technology 3rd Analytical Chemistry
P. 26
P1: GJB Revised Pages
Encyclopedia of Physical Science and Technology En001f25 May 7, 2001 13:58
Analytical Chemistry 565
and wax-impregnated graphite electrodes. Conventional TABLE XI Common Techniques for Polarographic Analysis
electrochemical cells are designed on the basis of three-
Technique Detection limit (M) Resolution (mV)
electrode (working, reference, counter) potentiostatic con-
trol, which allows work in solvents of high resistance. Classical polarography 10 −5 200
Polarography applies a continuous or pulsed or oscillat- Rapid-scan polarography 10 −7 50
ing potential ramp to the working electrode and observes Cyclic voltammetry 10 −7 50
the generation of a redox current as a function of applied Differential pulsed 10 −8 50
potential. Three mass transfer processes can control the polarography −8
rate of analyte deposition at the surface of the working Square wave voltammetry 10 −10 50
electrode: convection in the sample solution, migration of Stripping voltammetry 10 100
chargedionsintheappliedelectrostaticfield,anddiffusion
due to a concentration gradient. Experiments are usually
conducted without stirring and in 100-fold concentration lyte diffusion coefficient in square centimeters per second,
excess of an electrochemically inactive electrolyte to elim- C is the analyte concentration in millimoles per liter, m is
inate the first two processes. When the working electrode the rate of mercury mass flow in milligrams per second,
potential reaches a threshold value, dependent on the stan- and t is the drop time in seconds. This equation demon-
dard potential for the half-reaction of interest, oxidation strates that the diffusion-limited current is directly propor-
or reduction of the analyte at the electrode surface be- tional to analyte concentration.
gins. Concentration diffusion begins from bulk solution Numerous procedures for applying electric potential
and eventually reaches a steady state, indicated experi- have been developed to increase the sensitivity of polaro-
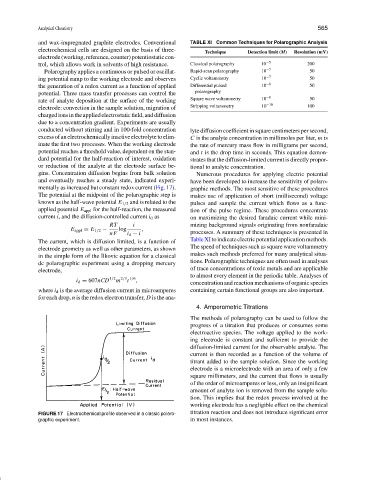
mentally as increased but constant redox current (Fig. 17). graphic methods. The most sensitive of these procedures
The potential at the midpoint of the polarographic step is makes use of application of short (millisecond) voltage
known as the half-wave potential E 1/2 and is related to the pulses and sample the current which flows as a func-
applied potential E appl for the half-reaction, the measured tion of the pulse regime. These procedures concentrate
current i, and the diffusion-controlled current i d as on maximizing the desired faradaic current while mini-
RT i mizing background signals originating from nonfaradaic
E appl = E 1/2 − log ,
nF i d − i processes. A summary of these techniques is presented in
Table XI to indicate electric potential application methods.
The current, which is diffusion limited, is a function of
The speed of techniques such as square wave voltammetry
electrode geometry as well as other parameters, as shown
in the simple form of the Ilkovic equation for a classical makes such methods preferred for many analytical situa-
dc polarographic experiment using a dropping mercury tions. Polarographic techniques are often used in analyses
electrode, of trace concentrations of toxic metals and are applicable
to almost every element in the periodic table. Analyses of
t
i d = 607nCD 1/2 m 2/3 1/6 ,
concentration and reaction mechanisms of organic species
where i d is the average diffusion current in microamperes containing certain functional groups are also important.
for each drop, n is the redox electron transfer, D is the ana-
4. Amperometric Titrations
The methods of polarography can be used to follow the
progress of a titration that produces or consumes some
electroactive species. The voltage applied to the work-
ing electrode is constant and sufficient to provide the
diffusion-limited current for the observable analyte. The
current is then recorded as a function of the volume of
titrant added to the sample solution. Since the working
electrode is a microelectrode with an area of only a few
square millimeters, and the current that flows is usually
of the order of microamperes or less, only an insignificant
amount of analyte ion is removed from the sample solu-
tion. This implies that the redox process involved at the
working electrode has a negligible effect on the chemical
FIGURE 17 Electrochemical profile observed in a classic polaro- titration reaction and does not introduce significant error
graphic experiment. in most instances.