
Page 29 - Academic Press Encyclopedia of Physical Science and Technology 3rd Analytical Chemistry
P. 29
P1: GJB Revised Pages
Encyclopedia of Physical Science and Technology En001f25 May 7, 2001 13:58
568 Analytical Chemistry
then amplified in number before measurement of the cur- for bond breakage, which allow us to predict the original
rent. It goes without saying that nearly the entire mass structure of a particular species. For example, ring com-
spectrometer must be kept under high vacuum with diffu- pounds usually contain mass numbers characteristic of the
sion pumps, backed by rotary oil pumps. If the spectrom- ring (due to its inherent stability). As can be appreciated,
eter is connected to a gas chromatograph, an interface is the whole philosophy behind working out the structure of
inserted between the inlet system and the chromatograph a complete unknown from its mass spectrum is akin to the
to allow sample transport but to remove carrier gas. Effu- development of a solved jigsaw puzzle. This procedure is
sion, membrane, and jet separators are used for this pur- quite different from the use of the computer to match the
pose. Finally, most modern high-resolution instruments mass spectrum of an “unknown” with its memory bank
utilize dedicated computers not only for data handling, but of data, as mentioned above. In this case we are using the
also for total control of the instrument. Many facilities are “fingerprint” approach to identification.
incorporated in these configurations—for example, com-
parison “libraries” of recorded mass spectra of thousands
F. Thermal Methods
of known compounds.
Thermal methods of analysis involve the measurement of
a physical property of a sample as a function of controlled
4. Analytical Use
temperature. Equipment is available for detecting transi-
The mass spectrometer is clearly of tremendous impor- tion temperatures, energies of transitions, weight loss, size
tance in the identification of chemical compounds. This changes, elasticity, and changes in solution temperature
is because the ionization of compounds produces unique plotted as a function of added volume of a reagent.
fragmentation patterns. Accordingly, the correlation of
mass spectra with molecular structure provides a beau- 1. Thermogravimetry
tiful foundation for chemical analysis. In identification
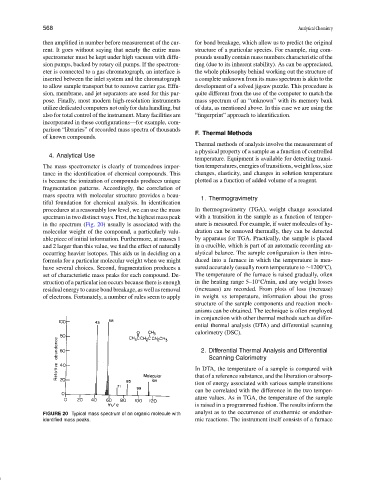
procedures at a reasonably low level, we can use the mass In thermogravimetry (TGA), weight change associated
spectrum in two distinct ways. First, the highest mass peak with a transition in the sample as a function of temper-
in the spectrum (Fig. 20) usually is associated with the ature is measured. For example, if water molecules of hy-
molecular weight of the compound, a particularly valu- dration can be removed thermally, they can be detected
able piece of initial information. Furthermore, at masses 1 by apparatus for TGA. Practically, the sample is placed
and 2 larger than this value, we find the effect of naturally in a crucible, which is part of an automatic recording an-
occurring heavier isotopes. This aids us in deciding on a alytical balance. The sample configuration is then intro-
formula for a particular molecular weight when we might duced into a furnace in which the temperature is mea-
◦
have several choices. Second, fragmentation produces a sured accurately (usually room temperature to ∼1200 C).
set of characteristic mass peaks for each compound. De- The temperature of the furnace is raised gradually, often
◦
struction of a particular ion occurs because there is enough in the heating range 5–10 C/min, and any weight losses
residual energy to cause bond breakage, as well as removal (increases) are recorded. From plots of loss (increase)
of electrons. Fortunately, a number of rules seem to apply in weight vs temperature, information about the gross
structure of the sample components and reaction mech-
anisms can be obtained. The technique is often employed
in conjunction with other thermal methods such as differ-
ential thermal analysis (DTA) and differential scanning
calorimetry (DSC).
2. Differential Thermal Analysis and Differential
Scanning Calorimetry
In DTA, the temperature of a sample is compared with
that of a reference substance, and the liberation or absorp-
tion of energy associated with various sample transitions
can be correlated with the difference in the two temper-
ature values. As in TGA, the temperature of the sample
is raised in a programmed fashion. The results inform the
FIGURE 20 Typical mass spectrum of an organic molecule with analyst as to the occurrence of exothermic or endother-
identified mass peaks. mic reactions. The instrument itself consists of a furnace