
Page 32 - Academic Press Encyclopedia of Physical Science and Technology 3rd Analytical Chemistry
P. 32
P1: GJB Revised Pages
Encyclopedia of Physical Science and Technology En001f25 May 7, 2001 13:58
Analytical Chemistry 571
where I(x) is the electron flux emerging at the surface for
0
a flux originating at depth x, I (x). The parameter λ is
˚
called the escape depth and is of the order of 20 A for
electrons of kinetic energy 500 eV. Clearly, only discrete
kinetic energies of electrons will be obtained from the first
few atomic layers.
The binding energies of core electrons are essentially
constant, within narrow limits, and are characteristic of
the atom concerned. Accordingly, a sweep of the binding
energy scale (computed directly from measured kinetic
energy and knowledge of the source energy corrected for
charging) for a particular sample leads to an elemental
identification (Fig. 24b). Furthermore, the precise binding
energy of a core electron varies with the oxidation state
or chemical environment of an element. This is called
the chemical shift effect and manifests for ionizations of
the same atomic orbital from different chemical situations
(Fig. 24c). Observation of this effect is particularly useful
in solving structural problems in an analogous fashion
to that used in nuclear magnetic resonance spectroscopy.
Additional features of core-electron spectra are shake-up
and multiplet structure.
There are many applications of XPS, particularly in the
area of surface analysis. It has been applied in such diverse
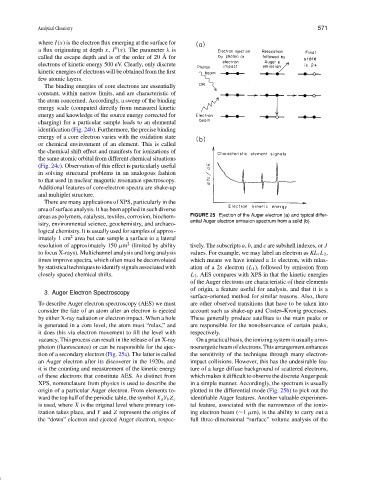
areas as polymers, catalysts, textiles, corrosion, biochem- FIGURE 25 Ejection of the Auger electron (a) and typical differ-
ential Auger electron emission spectrum from a solid (b).
istry, environmental science, geochemistry, and archaeo-
logical chemistry. It is usually used for samples of approx-
2
imately 1 cm area but can sample a surface to a lateral
2
resolution of approximately 150 µm (limited by ability tively. The subscripts a, b, and c are subshell indexes, or J
to focus X-rays). Multichannel analysis and long analysis values. For example, we may label an electron as KL 1 L 2 ,
times improve spectra, which often must be deconvoluted which means we have ionized a 1s electron, with relax-
by statistical techniques to identify signals associated with ation of a 2s electron (L 1 ), followed by emission from
closely spaced chemical shifts. L 2 . AES compares with XPS in that the kinetic energies
of the Auger electrons are characteristic of their elements
of origin, a feature useful for analysis, and that it is a
3. Auger Electron Spectroscopy
surface-oriented method for similar reasons. Also, there
To describe Auger electron spectroscopy (AES) we must are other observed transitions that have to be taken into
consider the fate of an atom after an electron is ejected account such as shake-up and Coster–Kronig processes.
by either X-ray radiation or electron impact. When a hole These generally produce satellites to the main peaks or
is generated in a core level, the atom must “relax,” and are responsible for the nonobservance of certain peaks,
it does this via electron movement to fill the level with respectively.
vacancy. This process can result in the release of an X-ray On a practical basis, the ionizing system is usually a mo-
photon (fluorescence) or can be responsible for the ejec- noenergeticbeamofelectrons.Thisarrangementenhances
tion of a secondary electron (Fig. 25a). The latter is called the sensitivity of the technique through many electron-
an Auger electron after its discoverer in the 1920s, and impact collisions. However, this has the undesirable fea-
it is the counting and measurement of the kinetic energy ture of a large diffuse background of scattered electrons,
of these electrons that constitute AES. As distinct from which makes it difficult to observe the discrete Auger peak
XPS, nomenclature from physics is used to describe the in a simple manner. Accordingly, the spectrum is usually
origin of a particular Auger electron. From elements to- plotted in the differential mode (Fig. 25b) to pick out the
identifiable Auger features. Another valuable experimen-
ward the top half of the periodic table, the symbol X a Y b Z c
is used, where X is the original level where primary ion- tal feature, associated with the narrowness of the ioniz-
ization takes place, and Y and Z represent the origins of ing electron beam (∼1 µm), is the ability to carry out a
the “down” electron and ejected Auger electron, respec- full three-dimensional “surface” volume analysis of the