
Page 403 - Academic Press Encyclopedia of Physical Science and Technology 3rd Analytical Chemistry
P. 403
P1: GTQ/GLE P2: GPJ Final Pages
Encyclopedia of Physical Science and Technology EN012C-562 July 26, 2001 15:30
10 Photoacoustic Spectroscopy
ergy represents total energy stored by photosystem I (PS I )
and photosystem II (PS II ).
Q ma − Q m
ES T = PS I + PS II = × 100
Q ma
Both PS I and PS II absorb the most part of the spectral
radiation in the visible range except in the far-red region,
where PS I alone absorbs. This was well demonstrated by
measuring the PS I associated activity using modulated far-
red light (700 nm). Hence any energy storage measured
using the modulated light in the spectral range between
400 and 695 nm in the presence of white background light
reflects the energy stored by both PS I and PS II .
By using a nonmodulated strong background far-red
light (>715 nm, which is absorbed only by PS I ), energy
storage of PS I can also be determined. The difference in
the amplitude of the signal in the absence (Q m ) and in the
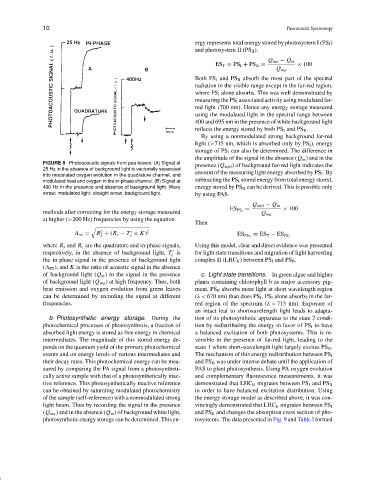
FIGURE 8 Photoacoustic signals from pea leaves. (A) Signal at
presence (Q mfrl ) of background far-red light indicates the
25 Hz in the absence of background light is vectorially separated
amount of the measuring light energy absorbed by PS I . By
into modulated oxygen evolution in the quadrature channel, and
modulated heat and oxygen in the in-phase channel. (B) Signal at subtracting the PS I stored energy from total energy stored,
400 Hz in the presence and absence of background light. Wavy energy stored by PS II can be derived. This is possible only
arrow: modulated light; straight arrow: background light. by using PAS.
Q mfrl − Q m
= × 100
ES PS I
methods after correcting for the energy storage measured Q ma
at higher (>200 Hz) frequencies by using the equation
Then
2
A ox = R + (R c − T × K) 2 ES PS II = ES T − ES PS I
c
s
where R s and R c are the quadrature and in-phase signals, Using this model, clear and direct evidence was presented
respectively, in the absence of background light, T is for light state transitions and migration of light harvesting
c
the in-phase signal in the presence of background light complex II (LHC II ) between PS I and PS II .
(A PT ), and K is the ratio of acoustic signal in the absence
of background light (Q m ) to the signal in the presence c. Light state transitions. In green algae and higher
of background light (Q ma ) at high frequency. Thus, both plants containing chlorophyll b as major accessory pig-
heat emission and oxygen evolution from green leaves ment, PS II absorbs more light at short wavelength region
can be determined by recording the signal at different (λ< 670 nm) than does PS I . PS I alone absorbs in the far-
frequencies. red region of the spectrum (λ> 715 nm). Exposure of
an intact leaf to shortwavelength light leads to adapta-
b. Photosynthetic energy storage. During the tion of its photosynthetic apparatus to the state 2 condi-
photochemical processes of photosynthesis, a fraction of tion by redistributing the energy in favor of PS I to have
absorbed light energy is stored as free energy in chemical a balanced excitation of both photosystems. This is re-
intermediates. The magnitude of this stored energy de- versible in the presence of far-red light, leading to the
pends on the quantum yield of the primary photochemical state 1 where short-wavelength light largely excites PS II .
events and on energy levels of various intermediates and The mechanism of this energy redistribution between PS I
their decay rates. This photochemical energy can be mea- and PS II was under intense debate until the application of
sured by comparing the PA signal from a photosyntheti- PAS to plant photosynthesis. Using PA oxygen evolution
cally active sample with that of a photosynthetically inac- and complementary fluorescence measurements, it was
tive reference. This photosynthetically inactive reference demonstrated that LHC II migrates between PS I and PS II
can be obtained by saturating modulated photochemistry in order to have balanced excitation distribution. Using
of the sample (self-reference) with a nonmodulated strong the energy storage model as described above, it was con-
light beam. Thus by recording the signal in the presence vincingly demonstrated that LHC II migrates between PS I
(Q ma ) and in the absence (Q m ) of background white light, and PS II and changes the absorption cross section of pho-
photosynthetic energy storage can be determined. This en- tosystems. The data presented in Fig. 9 and Table I formed