
Page 404 - Academic Press Encyclopedia of Physical Science and Technology 3rd Analytical Chemistry
P. 404
P1: GTQ/GLE P2: GPJ Final Pages
Encyclopedia of Physical Science and Technology EN012C-562 July 26, 2001 15:30
Photoacoustic Spectroscopy 11
This was the first time such quantitative information on
the amount of energy transfer between PS I and PS II was
provided. All these measurements were made with 650 nm
modulated light.
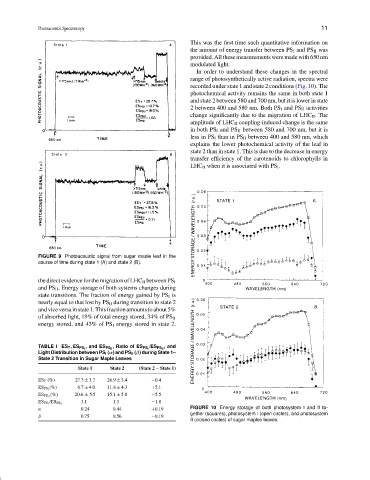
In order to understand these changes in the spectral
range of photosynthetically active radiation, spectra were
recorded under state 1 and state 2 conditions (Fig. 10). The
photochemical activity remains the same in both state 1
and state 2 between 580 and 700 nm, but it is lower in state
2 between 400 and 580 nm. Both PS I and PS II activities
change significantly due to the migration of LHC II . The
amplitude of LHC II coupling-induced change is the same
in both PS I and PS II between 580 and 700 nm, but it is
less in PS I than in PS II between 400 and 580 nm, which
explains the lower photochemical activity of the leaf in
state 2 than in state 1. This is due to the decrease in energy
transfer efficiency of the carotenoids to chlorophylls in
LHC II when it is associated with PS I .
FIGURE 9 Photoacoustic signal from sugar maple leaf in the
course of time during state 1 (A) and state 2 (B).
the direct evidence for the migration of LHC II between PS I
and PS II . Energy storage of both systems changes during
state transitions. The fraction of energy gained by PS I is
nearly equal to that lost by PS II during transition to state 2
andviceversainstate1.Thisfractionamountstoabout5%
of absorbed light, 19% of total energy stored, 34% of PS II
energy stored, and 43% of PS I energy stored in state 2.
, and
TABLE I ES T , ES PS I , and ES PS II , Ratio of ES PS I /ES PS II
Light Distribution between PS I (α) and PS II (β) during State 1–
State 2 Transition in Sugar Maple Leaves
State 1 State 2 (State 2 − State 1)
ES T (%) 27.3 ± 3.7 26.9 ± 3.4 −0.4
(%) 6.7 ± 4.0 11.8 ± 4.3 +5.1
ES PS I
(%) 20.6 ± 5.5 15.1 ± 5.8 −5.5
ES PS II
3.1 1.3 −1.8
ES PS I /ES PS II
α 0.24 0.44 +0.19 FIGURE 10 Energy storage of both photosystem I and II to-
gether (squares), photosystem I (open circles), and photosystem
β 0.75 0.56 −0.19
II (closed circles) of sugar maples leaves.