
Page 408 - Academic Press Encyclopedia of Physical Science and Technology 3rd Analytical Chemistry
P. 408
P1: GLQ Final pages
Encyclopedia of Physical Science and Technology EN012C-568 July 26, 2001 15:32
58 Photoelectron Spectroscopy
Before photoionization takes place, the system is in a well- scale for the binding energy at the bottom. The binding
defined electronic state, usually the electronic ground state energy scale is obtained from the kinetic energy scale by
M 0 , the initial state of the photoemission process. Irra- means of Eq. (2). It must be kept in mind, however, that
−
diation of the system with radiation of sufficiently high the quantity originally measured is E kin (e ), even when
energy hν leads to the ejection of a photoelectron. The only a scale for E B is shown. The scales in Fig. 1 run in
+
ion M that is created by this process is again in a well- different directions for different examples. This is not a
+
defined electronic state M which is the final state of the mistake but is due to different presentations of PE spec-
i
+
photoemission process. In general, the lifetime of M is tra in the literature. Some researchers show values of the
i
−
long enough to prevent successive changes in the ion state measured quantity E kin (e ) increasing from left to right,
from influencing the kinetic energy of the photoelectron. which results in the scale for E B running from right to left.
+
The final state is either the electronic ground state M or, This kind of display is especially common for PE spectra
0
provided hν is sufficiently high, an electronically excited of solid surfaces. Others are interested mainly in E B ,so
state of the ion. From conservation of energy it follows that they draw the E B scale with increasing energies from left
−
to right. Sometimes only the E kin (e ) scale or only the
+
E(M ) − E(M 0 ) + E kin (e ) + E kin (M ) = hν (1)
−
+
i E B scale is provided. As far as possible we will show both
+
where E(M 0 ) and E(M ) are the energies of the initial scales throughout this article, but when using spectra from
i
+
−
and final states, respectively, and E kin (e ) and E kin (M ) the literature one should always be aware of the scale used.
are the kinetic energies of the electron and of the ion. Figure 1 gives a first impression of different types of PE
+
Since E kin (e )/E kin (M ) is determined by the mass spectra. From Eq. (2) we expect photoelectrons to appear
−
ratio m(M )/m(e ), E kin (M ) can be neglected in most only at kinetic energies that correspond to a certain final
−
+
+
+
applications. This leads to state M . We therefore expect a PE spectrum to consist
i
of lines with widths defined by some experimental param-
+
−
E B (i) = E(M ) − E(M 0 ) = hν − E kin (e ) (2) eters. This is the result observed for neon (Fig. 1a). For
i
where E B (i) is called the “binding energy.” To avoid molecules, vibrational and rotational states are coupled to
confusion, this expression is used throughout this article. the electronic states and, as in optical spectroscopy, band
However, specifically in connection with the investigation spectra are obtained (Fig. 1b). In this case we speak of pho-
+
of free molecules, the energy difference E(M ) − E(M 0 ) toemission bands rather than photoemission lines. With
i
is also referred to as the “ionization energy” or “ionization the exception of the technique discussed in Section I.I, the
potential.” resolution achievable in PES is much lower than in opti-
If the excitation energy hν is known, Eq. (2) allows cal spectroscopy (Section III.B). If the sample is a solid
determination of E B (i) from the kinetic energy of the cre- (Fig. 1c), each band or line is preceded by a tail extending
ated photoelectrons. Photoelectron spectroscopy (PES) is towardlowerkineticenergies.Forlowkineticenergiesthis
basically the measurement of the kinetic energy of pho- leads to a considerable background. The tails are due to
toelectrons with the goal of deriving information about inelastic scattering of the photoelectrons within the solid.
binding energies. This definition distinguishes PES from The progress achieved with PES results from the fact
other methods in which photoionization is used mainly for that it is an energy-resolved method. Older methods for the
detection (e.g., laser-induced multiphoton ionization) and determination of binding energies were mainly based on a
not for determining binding energies. measurement of the photoionization current and depended
on a variable excitation energy. For a given excitation en-
ergy E a the photoionization current is proportional to the
B. Photoelectron Spectra
integral over the PE spectrum from E B = 0to E B = E a .
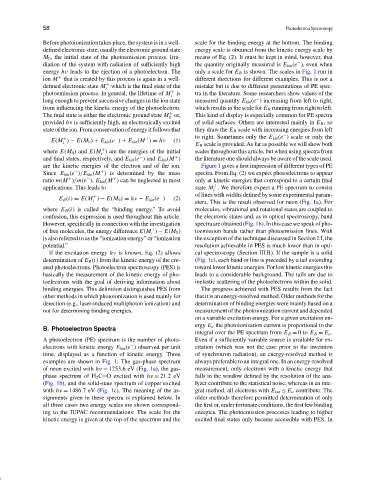
A photoelectron (PE) spectrum is the number of photo- Even if a sufficiently variable source is available for ex-
−
electrons with kinetic energy E kin (e ) observed per unit citation (which was not the case prior to the invention
time, displayed as a function of kinetic energy. Three of synchrotron radiation), an energy-resolved method is
examples are shown in Fig. 1: The gas-phase spectrum always preferable to an integral one. In an energy-resolved
of neon excited with h ν = 1253.6 eV (Fig. 1a), the gas- measurement, only electrons with a kinetic energy that
phase spectrum of H 2 C O excited with hν = 21.2eV falls in the window defined by the resolution of the ana-
(Fig. 1b), and the solid-state spectrum of copper excited lyzer contribute to the statistical noise, whereas in an inte-
with h ν = 1486.7 eV (Fig. 1c). The meaning of the as- gral method, all electrons with E kin ≤ E a contribute. The
signments given in these spectra is explained below. In older methods therefore permitted determination of only
all three cases two energy scales are shown correspond- the first or, under fortunate conditions, the first few binding
ing to the IUPAC recommendations: The scale for the energies. The photoemission processes leading to higher
kinetic energy is given at the top of the spectrum and the excited final states only became accessible with PES. In