
Page 411 - Academic Press Encyclopedia of Physical Science and Technology 3rd Analytical Chemistry
P. 411
P1: GLQ Final pages
Encyclopedia of Physical Science and Technology EN012C-568 July 26, 2001 15:32
Photoelectron Spectroscopy 61
2. For molecules it is often much more difficult to mea-
sure the optical spectrum of an ion than to measure the PE
spectrum of the parent molecule.
3. States with an excitation energy higher than about
6 eV are difficult to study in optical spectroscopy. This
is particularly important for highly excited ion states that
correspond to the removal of an inner shell electron.
4. For reasons discussed in Section II, the selection
rules are quite different for both types of spectroscopy.
The number of transitions allowed in photoemission is
usually much smaller than the number of allowed optical
transitions, especially at high excitation energies. There-
fore, PE spectra are considerably easier to interpret than
optical spectra, as will be seen in the following sections.
E. Photoelectron Spectra of Solids
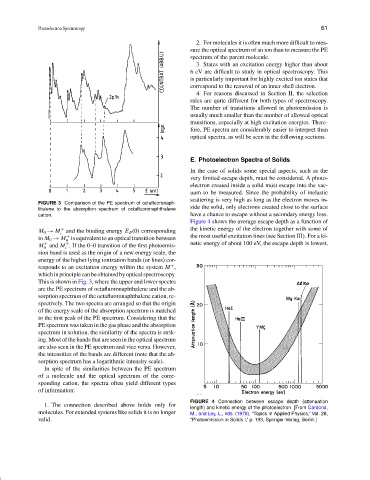
In the case of solids some special aspects, such as the
very limited escape depth, must be considered. A photo-
electron created inside a solid must escape into the vac-
uum to be measured. Since the probability of inelastic
scattering is very high as long as the electron moves in-
FIGURE 3 Comparison of the PE spectrum of octafluoronaph-
side the solid, only electrons created close to the surface
thalene to the absorption spectrum of octafluoronaphthalene
cation. have a chance to escape without a secondary energy loss.
Figure 4 shows the average escape depth as a function of
the kinetic energy of the electron together with some of
+
M 0 → M and the binding energy E B (0) corresponding
i
+
to M 0 → M is equivalent to an optical transition between the most useful excitation lines (see Section III). For a ki-
0
+
M and M . If the 0–0 transition of the first photoemis- netic energy of about 100 eV, the escape depth is lowest,
+
0 i
sion band is used as the origin of a new energy scale, the
energy of the higher lying ionization bands (or lines) cor-
responds to an excitation energy within the system M ,
+
whichinprinciplecanbeobtainedbyopticalspectroscopy.
This is shown in Fig. 3, where the upper and lower spectra
are the PE spectrum of octafluoronaphthalene and the ab-
sorption spectrum of the octafluoronaphthalene cation, re-
spectively. The two spectra are arranged so that the origin
of the energy scale of the absorption spectrum is matched
to the first peak of the PE spectrum. Considering that the
PE spectrum was taken in the gas phase and the absorption
spectrum in solution, the similarity of the spectra is strik-
ing. Most of the bands that are seen in the optical spectrum
are also seen in the PE spectrum and vice versa. However,
the intensities of the bands are different (note that the ab-
sorption spectrum has a logarithmic intensity scale).
In spite of the similarities between the PE spectrum
of a molecule and the optical spectrum of the corre-
sponding cation, the spectra often yield different types
of information:
FIGURE 4 Connection between escape depth (attenuation
1. The connection described above holds only for
length) and kinetic energy of the photoelectron. [From Cardona,
molecules. For extended systems like solids it is no longer M., and Ley, L., eds. (1978). “Topics in Applied Physics,” Vol. 26,
valid. “Photoemission in Solids I,” p. 193, Springer-Verlag, Berlin.]