
Page 410 - Academic Press Encyclopedia of Physical Science and Technology 3rd Analytical Chemistry
P. 410
P1: GLQ Final pages
Encyclopedia of Physical Science and Technology EN012C-568 July 26, 2001 15:32
60 Photoelectron Spectroscopy
in the chemical state, like different oxidation states or ex- gion is very likely for larger molecules), a photon can be
change of substituents, lead to small changes in the bind- absorbed by the neutral system. In case the final state M k
ing energy of core electrons. These changes or “chemi- of this process has a higher energy than the ground state
+
cal shifts” are the key to most analytical applications of of M , M k can decompose into an electron and a low-
+
high-energy PES. Because of the lower resolution, the in- lying state of M . Since both the initial and the final state
formation obtained for valence electrons is more limited of the autoionization (AI) process are well-defined elec-
than in UPS. The development of high-energy PES, which tronic states, the electron created in this process has the
is usually termed electron spectroscopy for chemical anal- well-defined kinetic energy
ysis (ESCA) or X-ray photoelectron spectroscopy (XPS), AI
+
−
E (e ) = E(M k ) − E(M ) (3)
began in 1914 with Robinson and Rawlinson’s investi- kin i
gation of the photoemission of gold. Steinhardt and Ser- In Eq. (3) we again neglected the rebound energy of the
fass succeeded in 1951 in the first analytical application, heavy particle. Unlike the kinetic energy of an electron
which was then perfected by K. Siegbahn and coworkers produced in process 1, E AI (e ) does not depend on hν.
−
kin
in Uppsala in the late 1950s. In 1981 Siegbahn was hon- Therefore, the binding energy scale has no meaning for
ored with the Nobel Prize for this significant development. autoionization peaks. These peaks appear primarily at low
Much of his pioneering work on the analysis of solid or- kinetic energies since autoionization is usually efficient
ganic and inorganic materials was published in a single only when the initial and final states of the process are
volume in 1967. A second volume following 2 years later close in energy.
contained applications to free molecules. Process 3 in Fig. 2, is a direct transition from M 0 to
states of M 2+ under simultaneous emission of two elec-
trons.AsdiscussedinSectionII,suchaprocesshasamuch
C. Competing Photoemission Processes
lower probability than process 1 and leads to a continuous
+
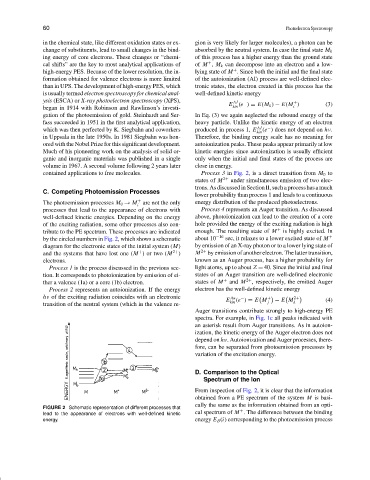
The photoemission processes M 0 → M are not the only energy distribution of the produced photoelectrons.
i
processes that lead to the appearance of electrons with Process 4 represents an Auger transition. As discussed
well-defined kinetic energies. Depending on the energy above, photoionization can lead to the creation of a core
of the exciting radiation, some other processes also con- hole provided the energy of the exciting radiation is high
tribute to the PE spectrum. These processes are indicated enough. The resulting state of M + is highly excited. In
by the circled numbers in Fig. 2, which shows a schematic about 10 −16 sec, it relaxes to a lower excited state of M +
diagram for the electronic states of the initial system (M) by emission of an X-ray photon or to a lower lying state of
+
and the systems that have lost one (M )ortwo(M 2+ ) M 2+ by emission of another electron. The latter transition,
electrons. known as an Auger process, has a higher probability for
Process 1 is the process discussed in the previous sec- light atoms, up to about Z = 40. Since the initial and final
tion. It corresponds to photoionization by emission of ei- states of an Auger transition are well-defined electronic
ther a valence (1a) or a core (1b) electron. states of M + and M 2+ , respectively, the emitted Auger
Process 2 represents an autoionization. If the energy electron has the well-defined kinetic energy
hν of the exciting radiation coincides with an electronic Au + 2+
E kin (e ) = E M j − E M k (4)
−
transition of the neutral system (which in the valence re-
Auger transitions contribute strongly to high-energy PE
spectra. For example, in Fig. 1c all peaks indicated with
an asterisk result from Auger transitions. As in autoion-
ization, the kinetic energy of the Auger electron does not
depend on hν. Autoionization and Auger processes, there-
fore, can be separated from photoemission processes by
variation of the excitation energy.
D. Comparison to the Optical
Spectrum of the Ion
From inspection of Fig. 2, it is clear that the information
obtained from a PE spectrum of the system M is basi-
cally the same as the information obtained from an opti-
FIGURE 2 Schematic representation of different processes that
+
lead to the appearance of electrons with well-defined kinetic cal spectrum of M . The difference between the binding
energy. energy E B (i) corresponding to the photoemission process