Page 435 - Academic Press Encyclopedia of Physical Science and Technology 3rd Analytical Chemistry
P. 435

P1: GLQ Final pages
 Encyclopedia of Physical Science and Technology  EN012C-568  July 26, 2001  15:32


              Photoelectron Spectroscopy                                                                   85


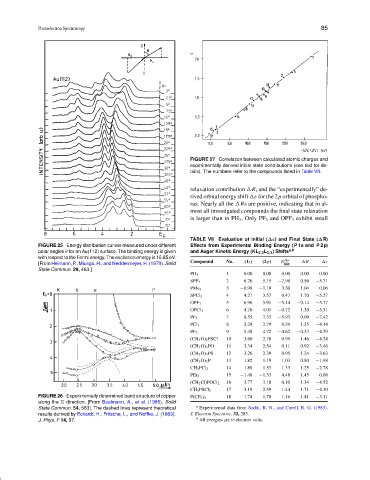
                                                                FIGURE 27 Correlation between calculated atomic charges and
                                                                experimentally derived initial state contributions (see text for de-
                                                                tails). The numbers refer to the compounds listed in Table VII.


                                                                relaxation contribution  R, and the “experimentally” de-
                                                                rived orbital energy shift  ε for the 2p orbital of phospho-
                                                                rus. Nearly all the  Rs are positive, indicating that in al-
                                                                most all investigated compounds the final state relaxation
                                                                is larger than in PH 3 . Only PF 3 and OPF 3 exhibit small


                                                                TABLE VII Evaluation of Initial (∆ε) and Final State (∆R)
              FIGURE 25 Energy distribution curves measured under different  Effects from Experimental Binding Energy (P 1s and P 2p)
              polar angles θ for an Au(112) surface. The binding energy is given  and Auger Kinetic Energy (KL 2,3 L 2,3 ) Shifts a,b
              with respect to the Fermi energy. The excitation energy is 16.85 eV.
                                                                Compound    No.   (1s)  (2p)  E  Au   R     ε
              [From Heimann, P., Miusga, H., and Neddermeyer, H. (1979). Solid                 kin
              State Commun. 29, 463.]
                                                                PH 3        1     0.00  0.00  0.00  0.00   0.00
                                                                SPF 3       2     6.20  5.15  −2.98  0.56  −5.71
                                                                PMe 3       3   −0.98  −1.10  3.30  1.04   0.06
                                                                SPCl 3      4     4.21  3.57  0.47  1.70  −5.27
                                                                OPF 3       5     6.96  5.91  −5.14  −0.14  −5.77
                                                                OPCl 3      6     4.70  4.01  −0.72  1.30  −5.31
                                                                PF 5        7     8.55  7.33  −5.93  0.09  −7.42
                                                                PCl 3       8     3.28  2.79  0.39  1.35  −4.14
                                                                PF 3        9     5.48  4.72  −4.62  −0.33  −4.39
                                                                (CH 3 O) 2 PSCl  10  3.60  2.78  0.95  1.46  −4.24
                                                                (CH 3 O) 3 PO  11  3.34  2.54  0.11  0.92  −3.46
                                                                (CH 3 O) 3 PS  12  3.26  2.39  0.95  1.24  −3.63
                                                                (CH 3 O) 3 P  13  1.82  1.19  1.03  0.80  −1.98
                                                                CH 3 PCl 2  14    1.89  1.53  1.33  1.25  −2.78
                                                                PEt 3       15  −1.48  −1.53  4.48  1.45   0.08
                                                                (CH 2 Cl)POCl 2  16  3.77  3.18  0.10  1.34  −4.52
                                                                CH 3 PSCl 2  17   3.19  2.59  1.44  1.71  −4.30
              FIGURE 26 Experimentally determined band structure of copper  P(CF 3 ) 3  18  1.74  1.70  1.16  1.41  −3.11
              along the    direction. [From Baalmann, A., et al. (1985). Solid
              State Commun. 54, 583]. The dashed lines represent theoretical  a  Experimental data from Sodhi, R. N., and Cavell, R. G. (1983).
              results derived by Eckardt, H., Fritsche, L., and Noffke, J. (1983).  J. Electron Spectrosc. 32, 283.
              J. Phys. F 14, 97.                                  b  All energies are in electron volts.
   430   431   432   433   434   435   436   437   438   439   440