
Page 434 - Academic Press Encyclopedia of Physical Science and Technology 3rd Analytical Chemistry
P. 434
P1: GLQ Final pages
Encyclopedia of Physical Science and Technology EN012C-568 July 26, 2001 15:32
84 Photoelectron Spectroscopy
FIGURE 23 Scheme of a band structure showing the constraints
imposed by simultaneous fulfillment of energy and momentum
conservation.
Consequently, energy distribution curves measured under
differentpolarangles,butusingthesameexcitationenergy
h ν, strongly depend on θ (Fig. 25). For two-dimensional
lattices which occur in well-ordered adsorbates or in layer
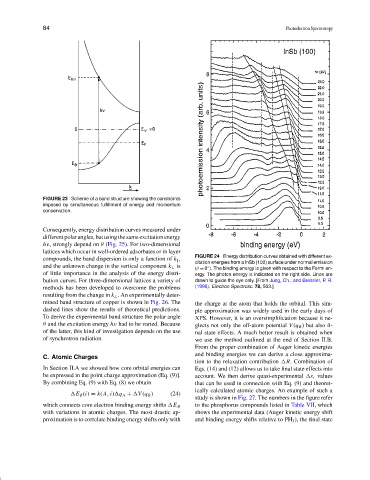
FIGURE 24 Energy distribution curves obtained with different ex-
compounds, the band dispersion is only a function of k ,
citation energies from a InSb (100) surface under normal emission
and the unknown change in the vertical component k ⊥ is
(θ = 0 ). The binding energy is given with respect to the Fermi en-
◦
of little importance in the analysis of the energy distri- ergy. The photon energy is indicated on the right side. Lines are
bution curves. For three-dimensional lattices a variety of drawn to guide the eye only. [From Jung, Ch., and Bressler, P. R.
methods has been developed to overcome the problems (1996). Electron Spectrosc. 78, 503.]
resulting from the change in k ⊥ . An experimentally deter-
mined band structure of copper is shown in Fig. 26. The the charge at the atom that holds the orbital. This sim-
dashed lines show the results of theoretical predictions. ple approximation was widely used in the early days of
To derive the experimental band structure the polar angle XPS. However, it is an oversimplification because it ne-
θ and the excitation energy hν had to be varied. Because glects not only the off-atom potential V (q B ) but also fi-
of the latter, this kind of investigation depends on the use nal state effects. A much better result is obtained when
of synchrotron radiation. we use the method outlined at the end of Section II.B.
From the proper combination of Auger kinetic energies
and binding energies we can derive a close approxima-
C. Atomic Charges
tion to the relaxation contribution R. Combination of
In Section II.A we showed how core orbital energies can Eqs. (14) and (12) allows us to take final state effects into
be expressed in the point charge approximation (Eq. (9)]. account. We then derive quasi-experimental ε i values
By combining Eq. (9) with Eq. (8) we obtain that can be used in connection with Eq. (9) and theoret-
ically calculated atomic charges. An example of such a
E B (i) = k(A, i) q A + V (q B ) (24)
study is shown in Fig. 27. The numbers in the figure refer
to the phosphorus compounds listed in Table VII, which
which connects core electron binding energy shifts E B
with variations in atomic charges. The most drastic ap- shows the experimental data (Auger kinetic energy shift
proximation is to correlate binding energy shifts only with and binding energy shifts relative to PH 3 ), the final state