
Page 44 - Academic Press Encyclopedia of Physical Science and Technology 3rd Analytical Chemistry
P. 44
P1: FYK/LSX Revised Pages P2: FWQ/FPW QC: FYD
Encyclopedia of Physical Science and Technology en001d42 April 28, 2001 15:9
768 Atomic Spectrometry
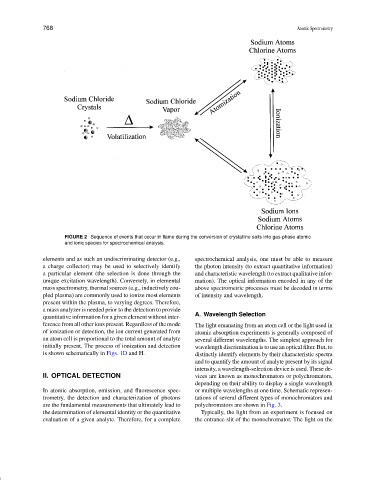
FIGURE 2 Sequence of events that occur in flame during the conversion of crystalline salts into gas-phase atomic
and ionic species for spectrochemical analysis.
elements and as such an undiscriminating detector (e.g., spectrochemical analysis, one must be able to measure
a charge collector) may be used to selectively identify the photon intensity (to extract quantitative information)
a particular element (the selection is done through the and characteristic wavelength (to extract qualitative infor-
unique excitation wavelength). Conversely, in elemental mation). The optical information encoded in any of the
mass spectrometry, thermal sources (e.g., inductively cou- above spectrometric processes must be decoded in terms
pled plasma) are commonly used to ionize most elements of intensity and wavelength.
present within the plasma, to varying degrees. Therefore,
a mass analyzer is needed prior to the detection to provide
A. Wavelength Selection
quantitative information for a given element without inter-
ference from all other ions present. Regardless of the mode The light emanating from an atom cell or the light used in
of ionization or detection, the ion current generated from atomic absorption experiments is generally composed of
an atom cell is proportional to the total amount of analyte several different wavelengths. The simplest approach for
initially present. The process of ionization and detection wavelength discrimination is to use an optical filter. But, to
is shown schematically in Figs. 1D and H. distinctly identify elements by their characteristic spectra
and to quantify the amount of analyte present by its signal
intensity, a wavelength-selection device is used. These de-
II. OPTICAL DETECTION vices are known as monochromators or polychromators,
depending on their ability to display a single wavelength
In atomic absorption, emission, and fluorescence spec- or multiple wavelengths at one time. Schematic represen-
trometry, the detection and characterization of photons tations of several different types of monochromators and
are the fundamental measurements that ultimately lead to polychromators are shown in Fig. 3.
the determination of elemental identity or the quantitative Typically, the light from an experiment is focused on
evaluation of a given analyte. Therefore, for a complete the entrance slit of the monochromator. The light on the