
Page 47 - Academic Press Encyclopedia of Physical Science and Technology 3rd Analytical Chemistry
P. 47
P1: FYK/LSX Revised Pages P2: FWQ/FPW QC: FYD
Encyclopedia of Physical Science and Technology en001d42 April 28, 2001 15:9
Atomic Spectrometry 771
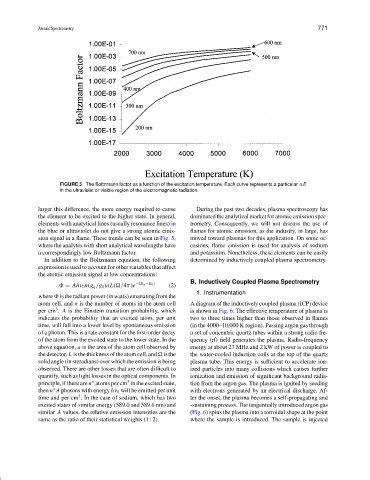
FIGURE 5 The Boltzmann factor as a function of the excitation temperature. Each curve represents a particular E
in the ultraviolet or visible region of the electromagnetic radiation.
larger this difference, the more energy required to cause During the past two decades, plasma spectroscopy has
the element to be excited to the higher state. In general, dominated the analytical market for atomic emission spec-
elements with analytical lines (usually resonance lines) in trometry. Consequently, we will not discuss the use of
the blue or ultraviolet do not give a strong atomic emis- flames for atomic emission, as the industry, in large, has
sion signal in a flame. These trends can be seen in Fig. 5, moved toward plasmas for this application. On some oc-
where the analytes with short analytical wavelengths have casions, flame emission is used for analysis of sodium
a correspondingly low Boltzmann factor. and potassium. Nonetheless, these elements can be easily
In addition to the Boltzmann equation, the following determined by inductively coupled plasma spectrometry.
expression is used to account for other variables that affect
the atomic emission signal at low concentrations:
B. Inductively Coupled Plasma Spectrometry
−(E q −E 0 )
= Ahν 0 n(g q /g 0 )aL( /4π)e (2)
1. Instrumentation
where is the radiant power (in watts) emanating from the
atom cell, and n is the number of atoms in the atom cell A diagram of the inductively coupled plasma (ICP) device
3
per cm . A is the Einstein transition probability, which is shown in Fig. 6. The effective temperature of plasma is
indicates the probability that an excited atom, per unit two to three times higher than those observed in flames
time, will fall into a lower level by spontaneous emission (in the 4000–10,000 K region). Passing argon gas through
of a photon. This is a rate constant for the first-order decay a set of concentric quartz tubes within a strong radio fre-
of the atom from the excited state to the lower state. In the quency (rf) field generates the plasma. Radio-frequency
above equation, a is the area of the atom cell observed by energy at about 27 MHz and 2 kW of power is coupled to
the detector, L is the thickness of the atom cell, and is the the water-cooled induction coils at the top of the quartz
solid angle (in steradians) over which the emission is being plasma tube. This energy is sufficient to accelerate ion-
observed. There are other losses that are often difficult to ized particles into many collisions which causes further
quantify, such as light losses in the optical components. In ionization and emission of significant background radia-
3
principle, if there are n atoms per cm in the excited state, tion from the argon gas. The plasma is ignited by seeding
∗
then n A photons with energy hν 0 will be emitted per unit with electrons generated by an electrical discharge. Af-
∗
3
time and per cm . In the case of sodium, which has two ter the onset, the plasma becomes a self-propagating and
excited states of similar energy (589.0 and 589.6 nm) and -sustaining process. The tangentially introduced argon gas
similar A values, the relative emission intensities are the (Fig. 6) spins the plasma into a torroidal shape at the point
same as the ratio of their statistical weights (1 : 2). where the sample is introduced. The sample is injected