
Page 50 - Academic Press Encyclopedia of Physical Science and Technology 3rd Analytical Chemistry
P. 50
P1: FYK/LSX Revised Pages P2: FWQ/FPW QC: FYD
Encyclopedia of Physical Science and Technology en001d42 April 28, 2001 15:9
774 Atomic Spectrometry
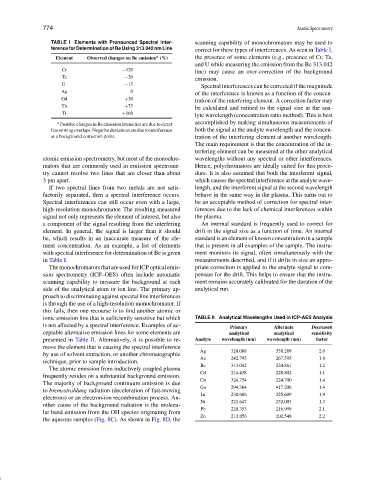
TABLE I Elements with Pronounced Spectral Inter- scanning capability of monochromators may be used to
ference for Determination of Be Using 313.042 nm Line correct for these types of interferences. As seen in Table I,
a
Element Observed changes on Be emission (%) the presence of some elements (e.g., presence of Cr, Ta,
and U while measuring the emission from the Be 313.042
Cr −120 line) may cause an over-correction of the background
Ta −20 emission.
U −15 Spectral interferences can be corrected if the magnitude
Ag 0 of the interference is known as a function of the concen-
Gd +30
tration of the interfering element. A correction factor may
Th +75
be calculated and ratioed to the signal size at the ana-
Ti +160
lyte wavelength (concentration ratio method). This is best
a Positive changes in Be emission intensities are due to direct accomplished by making simultaneous measurements of
lineorwingoverlaps.Negativedeviationsareduetointerference both the signal at the analyte wavelength and the concen-
at a background correction point. tration of the interfering element at another wavelength.
The main requirement is that the concentration of the in-
terfering element can be measured at the other analytical
atomic emission spectrometry, but most of the monochro- wavelengths without any spectral or other interferences.
mators that are commonly used in emission spectrome- Hence, polychromators are ideally suited for this proce-
try cannot resolve two lines that are closer than about dure. It is also assumed that both the interferent signal,
3 pm apart. which causes the spectral interference at the analyte wave-
If two spectral lines from two metals are not satis- length, and the interferent signal at the second wavelength
factorily separated, then a spectral interference occurs. behave in the same way in the plasma. This turns out to
Spectral interferences can still occur even with a large, be an acceptable method of correction for spectral inter-
high-resolution monochromator. The resulting measured ferences due to the lack of chemical interferences within
signal not only represents the element of interest, but also the plasma.
a component of the signal resulting from the interfering An internal standard is frequently used to correct for
element. In general, the signal is larger than it should drift in the signal size as a function of time. An internal
be, which results in an inaccurate measure of the ele- standard is an element of known concentration in a sample
ment concentration. As an example, a list of elements that is present in all examples of the sample. The instru-
with spectral interference for determination of Be is given ment monitors its signal, often simultaneously with the
in Table I. measurements described, and if it drifts in size an appro-
The monochromators that are used for ICP optical emis- priate correction is applied to the analyte signal to com-
sion spectrometry (ICP–OES) often include automatic pensate for the drift. This helps to ensure that the instru-
scanning capability to measure the background at each ment remains accurately calibrated for the duration of the
side of the analytical atom or ion line. The primary ap- analytical run.
proach to discriminating against spectral line interferences
is through the use of a high-resolution monochromator. If
this fails, then one recourse is to find another atomic or
ionic emission line that is sufficiently sensitive but which TABLE II Analytical Wavelengths Used in ICP-AES Analysis
is not affected by a spectral interference. Examples of ac- Primary Alternate Decreased
ceptable alternative emission lines for some elements are analytical analytical sensitivity
presented in Table II. Alternatively, it is possible to re- Analyte wavelength (nm) wavelength (nm) factor
move the element that is causing the spectral interference
Ag 328.068 338.289 2.0
by use of solvent extraction, or another chromatographic
Au 242.795 267.595 1.8
technique, prior to sample introduction.
Be 313.042 234.861 1.2
The atomic emission from inductively coupled plasma
Cd 214.438 228.802 1.1
frequently resides on a substantial background emission.
Cu 324.754 224.700 1.4
The majority of background continuum emission is due
Ga 294.364 417.206 1.4
to bremsstrahlung radiation (deceleration of fast-moving
In 230.606 325.609 1.9
electrons) or an electron-ion recombination process. An-
Ni 221.647 232.003 1.3
other cause of the background radiation is the molecu-
Pb 220.353 216.999 2.1
lar band emission from the OH species originating from
Zn 213.856 202.548 2.2
the aqueous samples (Fig. 8C). As shown in Fig. 8D, the