
Page 55 - Academic Press Encyclopedia of Physical Science and Technology 3rd Analytical Chemistry
P. 55
P1: FYK/LSX Revised Pages P2: FWQ/FPW QC: FYD
Encyclopedia of Physical Science and Technology en001d42 April 28, 2001 15:9
Atomic Spectrometry 779
contrast, ICP, AES, and AFS have linear dynamic ranges
of 3 to 6 orders of magnitude.
The flame: For AAS measurements it is necessary to
break down compounds in the flame into their constituent
elements. Air–acetylene and nitrous oxide–acetylene are
the most frequently used flame gases. Most elements can
be determined by AAS in the air–acetylene flame. The
nitrous oxide–acetylene flame is necessary for 5–15 ele-
ments whose compounds do not break down sufficiently
in the air–acetylene flame. Aluminum, for example, does
not produce a signal in the air–acetylene flame, while cal-
cium gives signals in both flames but a larger signal in the
nitrous-oxide flame. The burner used is usually a slotted
burner (Fig. 11), which allows for the maximum signal
due to the long absorption path length.
Modulation techniques to discriminate against back-
ground signals: The experimental arrangement for optical
modulation is shown in Fig. 11. As depicted in the fig-
ure, the hollow cathode lamp is placed on the optical axis
of the monochromator. In this arrangement, the incident
HCL radiation is split into two parts, one passing through
the flame and the other passing around the flame. A mir-
rored optical chopper is used in front of the HCL so that the
lightoutputisperiodicallyinterruptedandreroutedaround
the flame. This is called intensity modulation of the light
source output and is used to allow discrimination against
backgroundsignals.Thetwomainbackgroundsignalsthat
affect AAS (and AFS) measurements are the background
light emitted from the atom cell and the atomic emission
signals from the elements in the sample matrix. Atom
cells always have some inherent background luminosity.
While the background in the flame is due to the emis-
sions that result from the chemical reactions within the
flame, graphite furnace atomizers (see next section) emit
blackbody radiation. All atom cells are hot enough to ex-
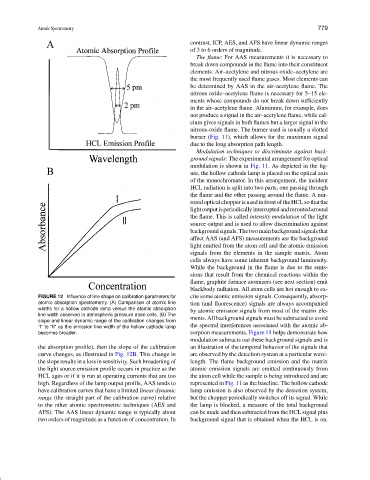
FIGURE 12 Influence of line shape on calibration parameters for cite some atomic emission signals. Consequently, absorp-
atomic absorption spectrometry. (A) Comparison of atomic line tion (and fluorescence) signals are always accompanied
widths for a hollow cathode lamp versus the atomic absorption by atomic emission signals from most of the matrix ele-
line width observed in atmospheric pressure atom cells. (B) The
slope and linear dynamic range of the calibration changes from ments. All background signals must be subtracted to avoid
“I” to “II” as the emission line width of the hollow cathode lamp the spectral interferences associated with the atomic ab-
becomes broader. sorption measurements. Figure 11 helps demonstrate how
modulation subtracts out these background signals and is
the absorption profile), then the slope of the calibration an illustration of the temporal behavior of the signals that
curve changes, as illustrated in Fig. 12B. This change in are observed by the detection system at a particular wave-
the slope results in a loss in sensitivity. Such broadening of length. The flame background emission and the matrix
the light source emission profile occurs in practice as the atomic emission signals are emitted continuously from
HCL ages or if it is run at operating currents that are too the atom cell while the sample is being introduced and are
high. Regardless of the lamp output profile, AAS tends to represented in Fig. 11 as the baseline. The hollow cathode
have calibration curves that have a limited linear dynamic lamp emission is also observed by the detection system,
range (the straight part of the calibration curve) relative but the chopper periodically switches off its signal. While
to the other atomic spectrometric techniques (AES and the lamp is blocked, a measure of the total background
AFS). The AAS linear dynamic range is typically about can be made and then subtracted from the HCL signal plus
two orders of magnitude as a function of concentration. In background signal that is obtained when the HCL is on.