
Page 52 - Academic Press Encyclopedia of Physical Science and Technology 3rd Analytical Chemistry
P. 52
P1: FYK/LSX Revised Pages P2: FWQ/FPW QC: FYD
Encyclopedia of Physical Science and Technology en001d42 April 28, 2001 15:9
776 Atomic Spectrometry
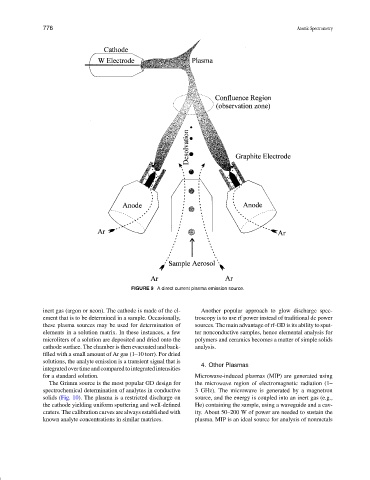
FIGURE 9 A direct current plasma emission source.
inert gas (argon or neon). The cathode is made of the el- Another popular approach to glow discharge spec-
ement that is to be determined in a sample. Occasionally, troscopy is to use rf power instead of traditional dc power
these plasma sources may be used for determination of sources. The main advantage of rf-GD is its ability to sput-
elements in a solution matrix. In these instances, a few ter nonconductive samples, hence elemental analysis for
microliters of a solution are deposited and dried onto the polymers and ceramics becomes a matter of simple solids
cathode surface. The chamber is then evacuated and back- analysis.
filled with a small amount of Ar gas (1–10 torr). For dried
solutions, the analyte emission is a transient signal that is 4. Other Plasmas
integrated over time and compared to integrated intensities
for a standard solution. Microwave-induced plasmas (MIP) are generated using
The Grimm source is the most popular GD design for the microwave region of electromagnetic radiation (1–
spectrochemical determination of analytes in conductive 3 GHz). The microwave is generated by a magnetron
solids (Fig. 10). The plasma is a restricted discharge on source, and the energy is coupled into an inert gas (e.g.,
the cathode yielding uniform sputtering and well-defined He) containing the sample, using a waveguide and a cav-
craters. The calibration curves are always established with ity. About 50–200 W of power are needed to sustain the
known analyte concentrations in similar matrices. plasma. MIP is an ideal source for analysis of nonmetals