
Page 54 - Academic Press Encyclopedia of Physical Science and Technology 3rd Analytical Chemistry
P. 54
P1: FYK/LSX Revised Pages P2: FWQ/FPW QC: FYD
Encyclopedia of Physical Science and Technology en001d42 April 28, 2001 15:9
778 Atomic Spectrometry
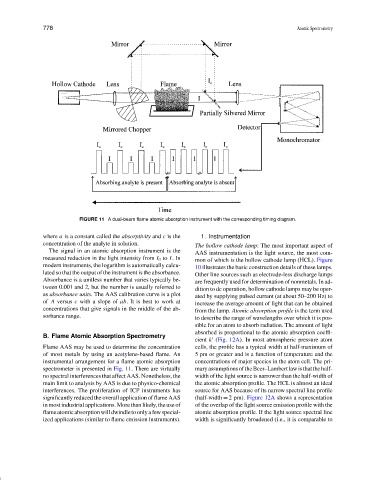
FIGURE 11 A dual-beam flame atomic absorption instrument with the corresponding timing diagram.
where a is a constant called the absorptivity and c is the 1. Instrumentation
concentration of the analyte in solution. The hollow cathode lamp: The most important aspect of
The signal in an atomic absorption instrument is the AAS instrumentation is the light source, the most com-
measured reduction in the light intensity from I 0 to I.In mon of which is the hollow cathode lamp (HCL). Figure
modern instruments, the logarithm is automatically calcu- 10 illustrates the basic construction details of these lamps.
lated so that the output of the instrument is the absorbance. Other line sources such as electrode-less discharge lamps
Absorbance is a unitless number that varies typically be- are frequently used for determination of nonmetals. In ad-
tween 0.001 and 2, but the number is usually referred to dition to dc operation, hollow cathode lamps may be oper-
as absorbance units. The AAS calibration curve is a plot ated by supplying pulsed current (at about 50–200 Hz) to
of A versus c with a slope of ab. It is best to work at increase the average amount of light that can be obtained
concentrations that give signals in the middle of the ab-
from the lamp. Atomic absorption profile is the term used
sorbance range.
to describe the range of wavelengths over which it is pos-
sible for an atom to absorb radiation. The amount of light
absorbed is proportional to the atomic absorption coeffi-
B. Flame Atomic Absorption Spectrometry
cient k (Fig. 12A). In most atmospheric pressure atom
Flame AAS may be used to determine the concentration cells, the profile has a typical width at half-maximum of
of most metals by using an acetylene-based flame. An 5 pm or greater and is a function of temperature and the
instrumental arrangement for a flame atomic absorption concentrations of major species in the atom cell. The pri-
spectrometer is presented in Fig. 11. There are virtually maryassumptionsoftheBeer–Lambertlawisthatthehalf-
no spectral interferences that affect AAS. Nonetheless, the width of the light source is narrower than the half-width of
main limit to analysis by AAS is due to physico-chemical the atomic absorption profile. The HCL is almost an ideal
interferences. The proliferation of ICP instruments has source for AAS because of its narrow spectral line profile
significantly reduced the overall application of flame AAS (half-width = 2 pm). Figure 12A shows a representation
in most industrial applications. More than likely, the use of of the overlap of the light source emission profile with the
flameatomicabsorptionwilldwindletoonlyafewspecial- atomic absorption profile. If the light source spectral line
ized applications (similar to flame emission instruments). width is significantly broadened (i.e., it is comparable to