
Page 49 - Academic Press Encyclopedia of Physical Science and Technology 3rd Analytical Chemistry
P. 49
P1: FYK/LSX Revised Pages P2: FWQ/FPW QC: FYD
Encyclopedia of Physical Science and Technology en001d42 April 28, 2001 15:9
Atomic Spectrometry 773
of simultaneous interrogation of many spectral lines. The
electronic data-handling system is then able to gather data
from a large number of elements simultaneously. Thirty
elements are typical, and as many as 60 elements are prac-
tical for an optimized analytical run.
3. Sensitivity
Atomic emission signals in the ICP are much larger
than those in the flame for nearly all elements and can
be obtained for a wider range of elements. The high-
temperature, inert-argon environment of the ICP leads to
a more complete atomization and efficient excitation of
analytes, resulting in larger signals.
The copious energy in the ICP causes some atoms to
become completely ionized. For analytes with extensive
ionization, the atomic emission signal is minute, but the
ionic emission signal is quite substantial. The concept of
an ionic emission signal is exactly the same as that of
atomic emission. An ion has a different set of energy lev-
els from the equivalent neutral atom (i.e., ionic emission
signals occur at different wavelengths from the atomic
emission signals). This duality of ICP spectrometry has
led to the use of the name optical emission spectrometry
(OES) for the ICP emission technique rather than atomic
emission spectrometry. Signals from ion transitions are
used just as routinely as atom lines for the determination
of the concentration of an analyte. Furthermore, the ions
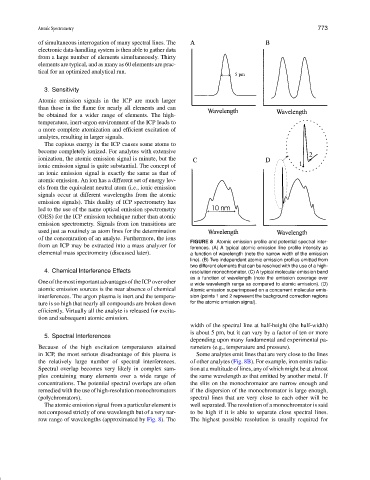
FIGURE 8 Atomic emission profile and potential spectral inter-
from an ICP may be extracted into a mass analyzer for
ferences. (A) A typical atomic emission line profile intensity as
elemental mass spectrometry (discussed later). a function of wavelength (note the narrow width of the emission
line). (B) Two independent atomic emission profiles emitted from
two different elements that can be resolved with the use of a high-
4. Chemical Interference Effects resolution monochromator. (C) A typical molecular emission band
as a function of wavelength (note the emission coverage over
OneofthemostimportantadvantagesoftheICPoverother a wide wavelength range as compared to atomic emission). (D)
atomic emission sources is the near absence of chemical Atomic emission superimposed on a concurrent molecular emis-
interferences. The argon plasma is inert and the tempera- sion (points 1 and 2 represent the background correction regions
ture is so high that nearly all compounds are broken down for the atomic emission signal).
efficiently. Virtually all the analyte is released for excita-
tion and subsequent atomic emission.
width of the spectral line at half-height (the half-width)
is about 5 pm, but it can vary by a factor of ten or more
5. Spectral Interferences
depending upon many fundamental and experimental pa-
Because of the high excitation temperatures attained rameters (e.g., temperature and pressure).
in ICP, the most serious disadvantage of this plasma is Some analytes emit lines that are very close to the lines
the relatively large number of spectral interferences. of other analytes (Fig. 8B). For example, iron emits radia-
Spectral overlap becomes very likely in complex sam- tion at a multitude of lines, any of which might be at almost
ples containing many elements over a wide range of the same wavelength as that emitted by another metal. If
concentrations. The potential spectral overlaps are often the slits on the monochromator are narrow enough and
remedied with the use of high-resolution monochromators if the dispersion of the monochromator is large enough,
(polychromators). spectral lines that are very close to each other will be
The atomic emission signal from a particular element is well separated. The resolution of a monochromator is said
not composed strictly of one wavelength but of a very nar- to be high if it is able to separate close spectral lines.
row range of wavelengths (approximated by Fig. 8). The The highest possible resolution is usually required for