
Page 204 - Academic Press Encyclopedia of Physical Science and Technology 3rd Polymer
P. 204
P1: GLM Final Pages
Encyclopedia of Physical Science and Technology EN012c-598 July 26, 2001 15:59
Polymers, Mechanical Behavior 713
cooperative segmental motion of the backbone, that is, a
“crank shaft” type of motion, which would lead to a much
larger scale mobility and potential flow. However, there
may be sufficient thermal energy to provide the onset of
local-scale motions such as the rotation of side groups,
oscillations of side groups, and oscillations and partial
torsional rotations of backbone components. All of these
motions lead to the dissipation of energy, and hence a
distinct loss peak is noted in the thermal mechanical spec-
trum. These low-temperature loss peaks are considered to
have great significance because their magnitude and num-
ber represent molecular means by which energy can be
dissipated in the glassy state. We shall return to this dis-
cussion when we consider impact properties. It should be
mentioned in passing that the two techniques of dielectric
spectroscopy and solid-state NMR are also used consider-
ably, since these methods can provide information on the
local molecular motions discussed above.
If a material is amorphous, it is not likely that addi-
tional loss mechanisms will be observed above the glass
transition temperature, although there has been some con-
troversy relating to this point. If, however, crystallinity
is present within the system, additional loss mechanisms
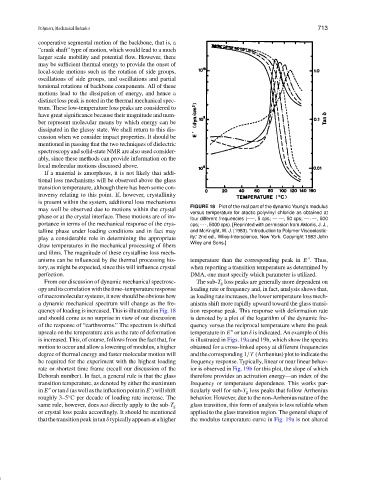
FIGURE 18 Plot of the real part of the dynamic Young’s modulus
may well be observed due to motions within the crystal
versus temperature for atactic polyvinyl chloride as obtained at
phase or at the crystal interface. These motions are of im-
four different frequencies (—–, 5 cps; — —, 50 cps; — · —, 500
portance in terms of the mechanical response of the crys- cps; - - -, 5000 cps). [Reprinted with permission from Aklonis, J. J.,
talline phase under loading conditions and in fact may and McKnight, W. J. (1983). “Introduction to Polymer Viscoelastic-
play a considerable role in determining the appropriate ity,” 2nd ed., Wiley-Interscience, New York. Copyright 1983 John
Wiley and Sons.]
draw temperatures in the mechanical processing of fibers
and films. The magnitude of these crystalline loss mech-
anisms can be influenced by the thermal processing his- temperature than the corresponding peak in E . Thus,
tory, as might be expected, since this will influence crystal when reporting a transition temperature as determined by
perfection. DMA, one must specify which parameter is utilized.
From our discussion of dynamic mechanical spectrosc- The sub-T g loss peaks are generally more dependent on
opyanditscorrelationwiththetime–temperatureresponse loading rate or frequency and, in fact, analysis shows that,
of macromolecular systems, it now should be obvious how as loading rate increases, the lower temperature loss mech-
a dynamic mechanical spectrum will change as the fre- anisms shift more rapidly upward toward the glass transi-
quency of loading is increased. This is illustrated in Fig. 18 tion response peak. This response with deformation rate
and should come as no surprise in view of our discussion is denoted by a plot of the logarithm of the dynamic fre-
of the response of “earthworms.” The spectrum is shifted quency versus the reciprocal temperature where the peak
upscale on the temperature axis as the rate of deformation temperature in E or tan δ is indicated. An example of this
is increased. This, of course, follows from the fact that, for is illustrated in Figs. 19a and 19b, which show the spectra
motion to occur and allow a lowering of modulus, a higher obtained for a cross-linked epoxy at different frequencies
degree of thermal energy and faster molecular motion will and the corresponding 1/T (Arrhenius) plot to indicate the
be required for the experiment with the highest loading frequency response. Typically, linear or near linear behav-
rate or shortest time frame (recall our discussion of the ior is observed in Fig. 19b for this plot, the slope of which
Deborah number). In fact, a general rule is that the glass therefore provides an activation energy—an index of the
transition temperature, as denoted by either the maximum frequency or temperature dependence. This works par-
in E ortan δ (aswellastheinflectionpointin E )willshift ticularly well for sub-T g loss peaks that follow Arrhenius
roughly 3–5 C per decade of loading rate increase. The behavior. However, due to the non-Arrhenius nature of the
◦
glass transition, this form of analysis is less reliable when
same rule, however, does not directly apply to the sub-T g
or crystal loss peaks accordingly. It should be mentioned applied to the glass transition region. The general shape of
that the transition peak in tan δ typically appears at a higher the modulus temperature curve in Fig. 19a is not altered