
Page 202 - Academic Press Encyclopedia of Physical Science and Technology 3rd Polymer
P. 202
P1: GLM Final Pages
Encyclopedia of Physical Science and Technology EN012c-598 July 26, 2001 15:59
Polymers, Mechanical Behavior 711
elastic components, only two of the three quantities are
independent, and thus all three are usually not reported.
Generally, the elastic component and one of the other two
parameters, either tan δ or E (or G ) are given.
Some specific examples of such a response obtained
in dynamic testing are shown in Figs. 17a–c. Some sig-
nificant observations can be made. First, under dynamic
conditions the elastic component E displays the same
characteristics as the modulus term discussed above in
terms of the thermal mechanical spectrum, and in fact the
two are essentially the same if the time frame of mea-
surement is equal for both. Hence, the dynamic mechan-
ical technique is very convenient and useful for generat-
ing the thermal mechanical spectrum. Second, tan δ (see
Fig. 17c) or E displays various maxima as a function
of temperature, indicating distinct “loss peaks.” Note that
some peaks occur below the glass transition temperature,
whereas the major loss peak is typical at the glass transi-
tion. In fact, for un-cross-linked materials that are amor-
phous, tan δ at T g will be of the order of 1.0 or somewhat
FIGURE 15 Generalized behavior of the phase relationship be-
above, indicating that the viscous component is equal to
tween stress and strain in a sinusoidal loading experiment. (a)
Hookean or pure elastic behavior, (b) Newtonian or pure viscous or exceeds that of the elastic component [recall Eq. (26)].
behavior, and (c) viscoelastic behavior, which is typical of poly- Above the glass transition temperature, however, the gen-
meric materials. eral loss again decays as is indicated, even though the
material shows higher mobility due to the enhancement
or dynamic loading as a function of temperature will dis- of thermal energy (i.e., increased kT ). If this is surpris-
play a finite phase angle whose magnitude is dependent on ing, the reader may view it in the following framework.
both the loading rate and temperature (Fig. 15c). (Think At a suitable rate and temperature, the dynamic loading
of how the worms would react.) Such dynamic loading resonates with the motion of the macromolecular sys-
patterns are characterized by the dynamic modulus (E ∗ tem, whose rapidity of motion increases as temperature
and G ) written below in terms of both tensile and shear increases. At the glass transition temperature these local
∗
deformation: modes of motion within the macromolecular chain can
E = E + iE , (25a) be somewhat viewed as being in phase with the applied
∗
dynamic loading. Hence, “mechanical resonance” results,
∗
G = G + iG . (25b)
leading to a considerable absorption of energy and high
The conventional symbolism used here represents com- values of tan δ. However, with enhanced thermal motion,
plex plane notation, where i denotes the square root of −1 there is a dephasing of the applied dynamic loading with
and is of little importance in our discussion. Rather, it is that of the molecular motion, and a decrease in tan δ
∗ ∗
most suitable for us to view E or G as a vector quantity occurs as E (or G ) decreases. It is clear that there is
made up of both the viscous and elastic components, as in- a further softening of the material by enhanced motion
dicated in Fig. 16, where the respective elastic component
(E or G ) and viscous component (E or G ) lie along
the x and y axes, respectively. It therefore follows that the
phase angle will be denoted by δ, and thus we reach the
obvious and important result that
tan δ = E /E = G /G . (26)
Hence, measurement of the phase angle provides a direct
ratio of the viscous (loss) to elastic (storage) components,
and this is a useful parameter for describing the mechani-
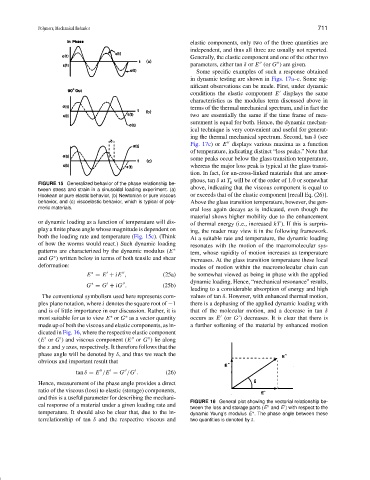
FIGURE 16 General plot showing the vectorial relationship be-
cal response of a material under a given loading rate and
tween the loss and storage parts (E and E ) with respect to the
temperature. It should also be clear that, due to the in- dynamic Young’s modulus E . The phase angle between these
∗
terrelationship of tan δ and the respective viscous and two quantities is denoted by δ.