
Page 198 - Academic Press Encyclopedia of Physical Science and Technology 3rd Polymer
P. 198
P1: GLM Final Pages
Encyclopedia of Physical Science and Technology EN012c-598 July 26, 2001 15:59
Polymers, Mechanical Behavior 707
or glassy region of the thermal mechanical spectrum. The
other region that is not strongly dependent on temperature
would display the properties and modulus behavior of a
5
6
soft elastomer (10 –10 Pa), and hence this region, C, is
known as the rubbery state or rubbery region of the spec-
trum. The modulus decreases by a factor of between 1000
and 10,000 on going from a glass to a soft elastomer—an
extremely large change. For this reason the temperature
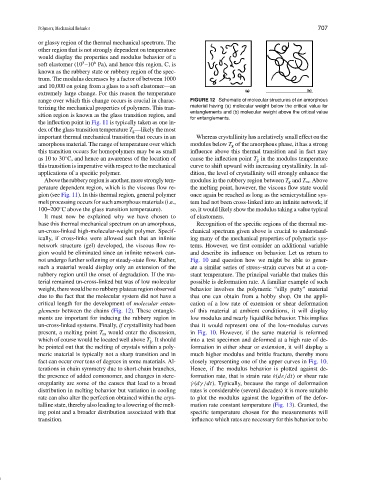
range over which this change occurs is crucial in charac- FIGURE 12 Schematic of molecular structures of an amorphous
terizing the mechanical properties of polymers. This tran- material having (a) molecular weight below the critical value for
entanglements and (b) molecular weight above the critical value
sition region is known as the glass transition region, and
for entanglements.
the inflection point in Fig. 11 is typically taken as one in-
dex of the glass transition temperature T g —likely the most
important thermal mechanical transition that occurs in an Whereas crystallinity has a relatively small effect on the
amorphous material. The range of temperature over which modulus below T g of the amorphous phase, it has a strong
this transition occurs for homopolymers may be as small influence above this thermal transition and in fact may
as 10 to 30 C, and hence an awareness of the location of cause the inflection point T g in the modulus temperature
◦
this transition is imperative with respect to the mechanical curve to shift upward with increasing crystallinity. In ad-
applications of a specific polymer. dition, the level of crystallinity will strongly enhance the
Above the rubbery region is another, more strongly tem- modulus in the rubbery region between T g and T m . Above
perature dependent region, which is the viscous flow re- the melting point, however, the viscous flow state would
gion (see Fig. 11). In this thermal region, general polymer once again be reached as long as the semicrystalline sys-
melt processing occurs for such amorphous materials (i.e., tem had not been cross-linked into an infinite network; if
100–200 C above the glass transition temperature). so, it would likely show the modulus taking a value typical
◦
It must now be explained why we have chosen to of elastomers.
base this thermal mechanical spectrum on an amorphous, Recognition of the specific regions of the thermal me-
un-cross-linked high-molecular-weight polymer. Specif- chanical spectrum given above is crucial to understand-
ically, if cross-links were allowed such that an infinite ing many of the mechanical properties of polymeric sys-
network structure (gel) developed, the viscous flow re- tems. However, we first consider an additional variable
gion would be eliminated since an infinite network can- and describe its influence on behavior. Let us return to
not undergo further softening or steady-state flow. Rather, Fig. 10 and question how we might be able to gener-
such a material would display only an extension of the ate a similar series of stress–strain curves but at a con-
rubbery region until the onset of degradation. If the ma- stant temperature. The principal variable that makes this
terial remained un-cross-linked but was of low molecular possible is deformation rate. A familiar example of such
weight, there would be no rubbery plateau region observed behavior involves the polymeric “silly putty” material
due to the fact that the molecular system did not have a that one can obtain from a hobby shop. On the appli-
critical length for the development of molecular entan- cation of a low rate of extension or shear deformation
glements between the chains (Fig. 12). These entangle- of this material at ambient conditions, it will display
ments are important for inducing the rubbery region in low modulus and nearly liquidlike behavior. This implies
un-cross-linked systems. Finally, if crystallinity had been that it would represent one of the low-modulus curves
present, a melting point T m would enter the discussion, in Fig. 10. However, if the same material is reformed
which of course would be located well above T g . It should into a test specimen and deformed at a high rate of de-
be pointed out that the melting of crystals within a poly- formation in either shear or extension, it will display a
meric material is typically not a sharp transition and in much higher modulus and brittle fracture, thereby more
fact can occur over tens of degrees in some materials. Al- closely representing one of the upper curves in Fig. 10.
terations in chain symmetry due to short-chain branches, Hence, if the modulus behavior is plotted against de-
the presence of added comonomer, and changes in stere- formation rate, that is strain rate ˙ε(d ε/dt) or shear rate
oregularity are some of the causes that lead to a broad ˙ γ (d γ/dt). Typically, because the range of deformation
distribution in melting behavior but variation in cooling rates is considerable (several decades) it is more suitable
rate can also alter the perfection obtained within the crys- to plot the modulus against the logarithm of the defor-
talline state, thereby also leading to a lowering of the melt- mation rate constant temperature (Fig. 13). Granted, the
ing point and a broader distribution associated with that specific temperature chosen for the measurements will
transition. influence which rates are necessary for this behavior to be