
Page 194 - Academic Press Encyclopedia of Physical Science and Technology 3rd Polymer
P. 194
P1: GLM Final Pages
Encyclopedia of Physical Science and Technology EN012c-598 July 26, 2001 15:59
Polymers, Mechanical Behavior 703
undergoes further elongation, and in the case of polymeric
systems, this tends to promote further chain alignment or
molecular orientation until failure occurs at σ b and ε b .
A final parameter, which is very significant in Fig. 5,
is the initial slope of the stress–strain curve. This slope is
called Young’s modulus, the tensile modulus, or modulus
of elasticity and is given the symbol E. By definition this
can be written
E = lim(d σ 0 /d ε). (8)
ε→0
This parameter is an index of the stiffness of the material
since it represents the stress generated in the limit of small
deformation. This stiffness parameter is particularly sig-
nificant in this article. It might be pointed out that if the
stress–strain curve displays an initial “toe” in its behavior
prior to it displaying a linear region, this is often due to a
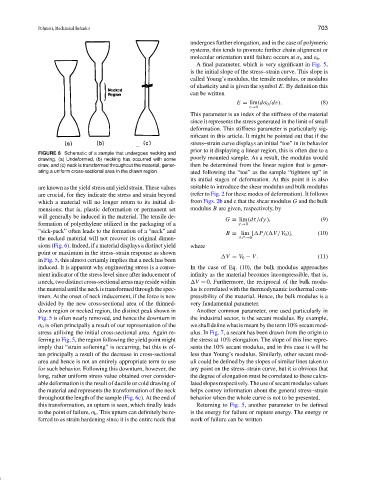
FIGURE 6 Schematic of a sample that undergoes necking and
poorly mounted sample. As a result, the modulus would
drawing. (a) Undeformed, (b) necking has occurred with some
draw, and (c) neck is transformed throughout the material, gener- then be determined from the linear region that is gener-
ating a uniform cross-sectional area in the drawn region. ated following the “toe” as the sample “tightens up” in
its initial stages of deformation. At this point it is also
are known as the yield stress and yield strain. These values suitable to introduce the shear modulus and bulk modulus
are crucial, for they indicate the stress and strain beyond (refer to Fig. 2 for these modes of deformation). It follows
which a material will no longer return to its initial di- from Figs. 2b and c that the shear modulus G and the bulk
mensions; that is, plastic deformation or permanent set modulus B are given, respectively, by
will generally be induced in the material. The tensile de-
G ≡ lim(d τ/d γ ), (9)
formation of polyethylene utilized in the packaging of a γ →0
“sick-pack” often leads to the formation of a “neck” and
B ≡ lim [ P /( V /V 0 )], (10)
the necked material will not recover its original dimen- P →0
sions (Fig. 6). Indeed, if a material displays a distinct yield where
point or maximum in the stress–strain response as shown
V = V 0 − V . (11)
in Fig. 5, this almost certainly implies that a neck has been
induced. It is apparent why engineering stress is a conve- In the case of Eq. (10), the bulk modulus approaches
nient indicator of the stress level since after inducement of infinity as the material becomes incompressible, that is,
aneck,twodistinctcross-sectionalareasmayresidewithin V = 0. Furthermore, the reciprocal of the bulk modu-
the material until the neck is transformed through the spec- lus is correlated with the thermodynamic isothermal com-
imen. At the onset of neck inducement, if the force is now pressibility of the material. Hence, the bulk modulus is a
divided by the new cross-sectional area of the thinned- very fundamental parameter.
down region or necked region, the distinct peak shown in Another common parameter, one used particularly in
Fig. 5 is often nearly removed, and hence the downturn in the industrial sector, is the secant modulus. By example,
σ 0 is often principally a result of our representation of the we shall define what is meant by the term 10% secant mod-
stress utilizing the initial cross-sectional area. Again re- ulus. In Fig. 7, a secant has been drawn from the origin to
ferring to Fig. 5, the region following the yield point might the stress at 10% elongation. The slope of this line repre-
imply that “strain softening” is occurring, but this is of- sents the 10% secant modulus, and in this case it will be
ten principally a result of the decrease in cross-sectional less than Young’s modulus. Similarly, other secant mod-
area and hence is not an entirely appropriate term to use uli could be defined by the slopes of similar lines taken to
for such behavior. Following this downturn, however, the any point on the stress–strain curve, but it is obvious that
long, rather uniform stress value obtained over consider- the degree of elongation must be correlated to these calcu-
able deformation is the result of ductile or cold drawing of latedslopesrespectively.Theuseofsecantmodulusvalues
the material and represents the transformation of the neck helps convey information about the general stress–strain
throughout the length of the sample (Fig. 6c). At the end of behavior when the whole curve is not to be presented.
this transformation, an upturn is seen, which finally leads Returning to Fig. 5, another parameter to be defined
to the point of failure, σ b . This upturn can definitely be re- is the energy for failure or rupture energy. The energy or
ferred to as strain hardening since it is the entire neck that work of failure can be written