
Page 191 - Academic Press Encyclopedia of Physical Science and Technology 3rd Polymer
P. 191
P1: GLM Final Pages
Encyclopedia of Physical Science and Technology EN012c-598 July 26, 2001 15:59
700 Polymers, Mechanical Behavior
deformation. In many tests, the loading profile can be ana- force generated along the deformation axis that reflects the
lyzed in terms of a combination of the above, but for sim- resistance to further deformation. If the amount or cross-
plicity we shall discuss each of these separately; we shall sectional area of the rubber band is increased, the force
place emphasis on the uniaxial mode of tensile deforma- will also increase for the same elongation. This suggests
tion since this is a particularly common procedure for test- the need to normalize the size of the test specimen so that
ing the mechanical response of a solid system. (Polymer the results from specimens of different sizes can be com-
fluids and their mechanical response are most often char- pared. This is done by one of two approaches. The first
acterized by simple shear deformation.) and most common is to divide the measured force by the
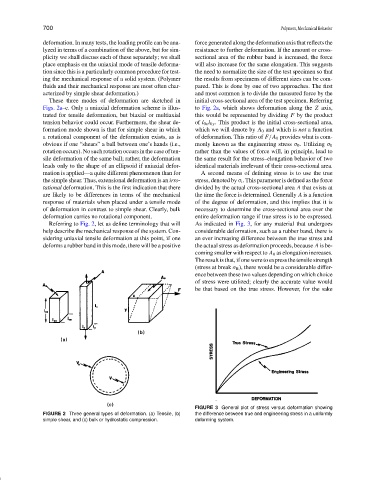
These three modes of deformation are sketched in initial cross-sectional area of the test specimen. Referring
Figs. 2a–c. Only a uniaxial deformation scheme is illus- to Fig. 2a, which shows deformation along the Z axis,
trated for tensile deformation, but biaxial or multiaxial this would be represented by dividing F by the product
tension behavior could occur. Furthermore, the shear de- of l 0x l 0y . This product is the initial cross-sectional area,
formation mode shown is that for simple shear in which which we will denote by A 0 and which is not a function
a rotational component of the deformation exists, as is of deformation. This ratio of F /A 0 provides what is com-
obvious if one “shears” a ball between one’s hands (i.e., monly known as the engineering stress σ 0 . Utilizing σ 0
rotation occurs). No such rotation occurs in the case of ten- rather than the values of force will, in principle, lead to
sile deformation of the same ball; rather, the deformation the same result for the stress–elongation behavior of two
leads only to the shape of an ellipsoid if uniaxial defor- identical materials irrelevant of their cross-sectional area.
mation is applied—a quite different phenomenon than for A second means of defining stress is to use the true
the simple shear. Thus, extensional deformation is an irro- stress, denoted by σ t . This parameter is defined as the force
tational deformation. This is the first indication that there divided by the actual cross-sectional area A that exists at
are likely to be differences in terms of the mechanical the time the force is determined. Generally A is a function
response of materials when placed under a tensile mode of the degree of deformation, and this implies that it is
of deformation in contrast to simple shear. Clearly, bulk necessary to determine the cross-sectional area over the
deformation carries no rotational component. entire deformation range if true stress is to be expressed.
Referring to Fig. 2, let us define terminology that will As indicated in Fig. 3, for any material that undergoes
help describe the mechanical response of the system. Con- considerable deformation, such as a rubber band, there is
sidering uniaxial tensile deformation at this point, if one an ever increasing difference between the true stress and
deforms a rubber band in this mode, there will be a positive the actual stress as deformation proceeds, because A is be-
coming smaller with respect to A 0 as elongation increases.
The result is that, if one were to express the tensile strength
(stress at break σ B ), there would be a considerable differ-
ence between these two values depending on which choice
of stress were utilized; clearly the accurate value would
be that based on the true stress. However, for the sake
FIGURE 3 General plot of stress versus deformation showing
FIGURE 2 Three general types of deformation. (a) Tensile, (b) the difference between true and engineering stress in a uniformly
simple shear, and (c) bulk or hydrostatic compression. deforming system.