
Page 195 - Academic Press Encyclopedia of Physical Science and Technology 3rd Polymer
P. 195
P1: GLM Final Pages
Encyclopedia of Physical Science and Technology EN012c-598 July 26, 2001 15:59
704 Polymers, Mechanical Behavior
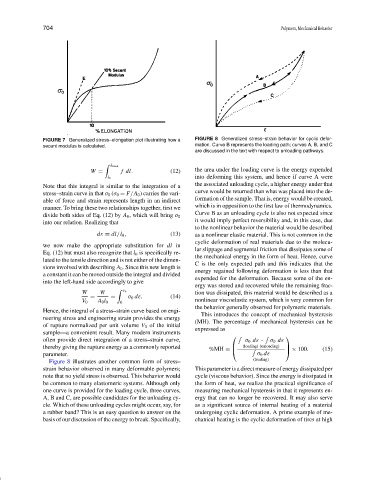
FIGURE 7 Generalized stress–elongation plot illustrating how a FIGURE 8 Generalized stress–strain behavior for cyclic defor-
secant modulus is calculated. mation. Curve B represents the loading path; curves A, B, and C
are discussed in the text with respect to unloading pathways.
l break
W = f dl. (12) the area under the loading curve is the energy expended
into deforming this system, and hence if curve A were
l 0
Note that this integral is similar to the integration of a the associated unloading cycle, a higher energy under that
stress–strain curve in that σ 0 (σ 0 = F /A 0 ) carries the vari- curve would be returned than what was placed into the de-
able of force and strain represents length in an indirect formation of the sample. That is, energy would be created,
manner. To bring these two relationships together, first we which is in opposition to the first law of thermodynamics.
Curve B as an unloading cycle is also not expected since
divide both sides of Eq. (12) by A 0 , which will bring σ 0
into our relation. Realizing that it would imply perfect reversibility and, in this case, due
to the nonlinear behavior the material would be described
d ε = dl /l 0 , (13) as a nonlinear elastic material. This is not common in the
cyclic deformation of real materials due to the molecu-
we now make the appropriate substitution for dl in
lar slippage and segmental friction that dissipates some of
Eq. (12) but must also recognize that l 0 is specifically re-
the mechanical energy in the form of heat. Hence, curve
lated to the tensile direction and is not either of the dimen-
C is the only expected path and this indicates that the
sions involved with describing A 0 . Since this new length is
energy regained following deformation is less than that
a constant it can be moved outside the integral and divided
expended for the deformation. Because some of the en-
into the left-hand side accordingly to give
ergy was stored and recovered while the remaining frac-
W W ε b tion was dissipated, this material would be described as a
= = σ 0 d ε. (14)
V 0 A 0 l 0 0 nonlinear viscoelastic system, which is very common for
the behavior generally observed for polymeric materials.
Hence, the integral of a stress–strain curve based on engi-
This introduces the concept of mechanical hysteresis
neering stress and engineering strain provides the energy
(MH). The percentage of mechanical hysteresis can be
of rupture normalized per unit volume V 0 of the initial
expressed as
sample—a convenient result. Many modern instruments
often provide direct integration of a stress–strain curve, σ 0 dε − σ 0 dε
thereby giving the rupture energy as a commonly reported (loading) (unloading)
× 100. (15)
%MH =
parameter. σ 0 dε
(loading)
Figure 8 illustrates another common form of stress–
strain behavior observed in many deformable polymers; This parameter is a direct measure of energy dissipated per
note that no yield stress is observed. This behavior would cycle (viscous behavior). Since the energy is dissipated in
be common to many elastomeric systems. Although only the form of heat, we realize the practical significance of
one curve is provided for the loading cycle, three curves, measuring mechanical hysteresis in that it represents en-
A, B and C, are possible candidates for the unloading cy- ergy that can no longer be recovered. It may also serve
cle. Which of these unloading cycles might occur, say, for as a significant source of internal heating of a material
a rubber band? This is an easy question to answer on the undergoing cyclic deformation. A prime example of me-
basis of our discussion of the energy to break. Specifically, chanical heating is the cyclic deformation of tires at high