
Page 206 - Academic Press Encyclopedia of Physical Science and Technology 3rd Polymer
P. 206
P1: GLM Final Pages
Encyclopedia of Physical Science and Technology EN012c-598 July 26, 2001 15:59
Polymers, Mechanical Behavior 715
FIGURE 20 Plot of the real part of the dynamic shear modulus G
versus temperature for three frequencies (-- -, 0.1 Hz; ——– , 1 Hz;
- · - · -, 10 Hz) as obtained on conventional polycarbonate.
[Reprinted with permission from Boden, H. E. (1984). Adv. Polym.
Technol. 3(4), 383.] FIGURE 22 General time-dependent behavior of stress and
strain for the conditions of stress relaxation and creep.
VI. STRESS RELAXATION AND
CREEP BEHAVIOR a fixed strain is imposed on a material and held while
the stress is monitored as a function of time. The reverse
Two important mechanical tests that have not yet been situation occurs for creep; that is, dimensional changes
mentioned are those of stress relaxation and creep. Both occur with time under a fixed load or stress. The re-
can be carried out in either tension or in shear, but for sponse obtained by these different tests can be viewed
convenience we shall continue our discussion in terms in terms of the earthworm analogy of macromolecules
of tensile deformation. The general characteristics of and the Deborah number concept. Picture a stress re-
both the stress relaxation and creep tests are indicated laxation experiment under ambient conditions utilizing
in Fig. 22, where it can be seen that in stress relaxation “silly putty.” We expect a finite stress to develop when
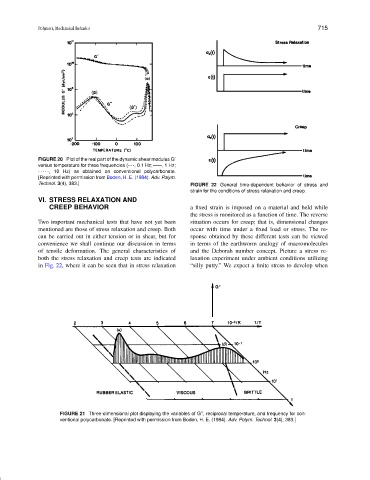
FIGURE 21 Three-dimensional plot displaying the variables of G , reciprocal temperature, and frequency for con-
ventional polycarbonate. [Reprinted with permission from Boden, H. E. (1984). Adv. Polym. Technol. 3(4), 383.]