
Page 49 - Academic Press Encyclopedia of Physical Science and Technology 3rd Molecular Biology
P. 49
P1: GPB Final Pages
Encyclopedia of Physical Science and Technology EN004L-956 June 9, 2001 21:7
600 DNA Testing in Forensic Science
(light on dark) recorded by the CCD camera, and Fig. 7B ing. The guidelines for those validations for laboratories
is the reverse image (dark on light) that is reminiscent of in the United States are governed by the DNA Advisory
an RFLP autoradiograph or lumigraph. It should be noted Board Guidelines (as of October 1, 1998) as implemented
that the scanning time is added onto the electrophoresis by ASCLD-LAB. Other areas of the world are regulated
time, with increased time for each color read. by other guidelines, unless they are also ASCLD-LAB
The second type of imaging system is a real time sys- accredited.
tem, in which the DNA fragments, after the bands have
been resolved, pass beneath a light source scanner that re-
A. STR Detection
covers the spectrum of light from the different fluorophors.
®
This is the ABI Prism system from PE Biosystems. It in- The major difference in the typing of the STR loci is the
cludes the older Model 373 DNA Sequencer and 377 DNA ability to include an internal size standard if the detection
Sequencer, which use slab acrylamide electrophoresis device used has multicolor capability. Under the TWG-
to separate the DNA fragments, and the 310 and 3100 DAM Guidelines forensic samples are to be placed ad-
Genetic Analyzers which use capillary electrophoresis to jacent to an allele ladder, as seen in Fig. 7 (PCR–STR).
separate the DNA fragments. Capillary electrophoresis is Since the Beckman Genomyx SC only has two filters (flu-
a technology in which a fine glass capillary is filled with a oroscein and TMR) an internal ladder could not be used, so
proprietary separation polymer. The sample is pulled into the adjacent ladder format is used. In this situation there is
the capillary by applying an electric current to it, then us- no special preparation for detection. When the four-color
ing high-voltage electrophoresis (12,000 V), and the DNA Hitachi FMBIO II Fluorescent Scanner, ABI Prism 377
fragments are separated over the length of the column and or 310 is used, an internal standard is used to size the
move past a laser detector. The 377 can put approximately DNA fragements. As part of the electrophoresis setup a
60samplesonagelatonetime,andwithmodifications,96. ROX ladder is added to PE Biosystems amplified prod-
In contrast, the 310 CE system does one sample at a time, ucts while a CRX ladder is added to Promega kits. (See
with a separation time of approximately 20 min. However, Figure 8 for example.) Amplified products including the
as this is automated, a cassette can be filled with samples
for testing and left to run unattended. The 3100 uses 10
capillary tubes with higher throughput. The output of these
devices is not a CCD image, but a series of electrophero-
grams with a profile for each color scanned (nominally
Blue, Green, Yellow, and Red). Since these are difficult to
interpret the computer software provides decomposed sin-
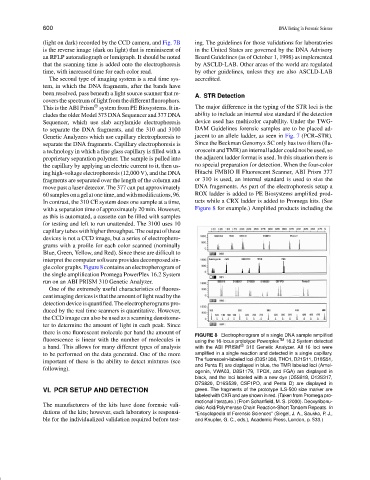
gle color graphs. Figure 8 contains an electropherogram of
the single amplification Promega PowerPlex 16.2 System
run on an ABI PRISM 310 Genetic Analyzer.
One of the extremely useful characteristics of fluores-
cent imaging devices is that the amount of light read by the
detection device is quantified. The electropherograms pro-
duced by the real time scanners is quantitative. However,
the CCD image can also be used as a scanning densitome-
ter to determine the amount of light in each peak. Since
there is one fluorescent molecule per band the amount of
FIGURE 8 Electropherogram of a single DNA sample amplified
fluorescence is linear with the number of molecules in using the 16-locus prototype Powerplex TM 16.2 System detected
a band. This allows for many different types of analysis with the ABI PRISM ® 310 Genetic Analyzer. All 16 loci were
to be performed on the data generated. One of the more amplified in a single reaction and detected in a single capillary.
important of these is the ability to detect mixtures (see The fluorescein-labeled loci (D3S1358, THO1, D21S11, D18S51,
and Penta E) are displayed in blue, the TMR labeled loci (Amel-
following).
ogenin, VWA03, D8S1179, TPOX, and FGA) are displayed in
black, and the loci labeled with a new dye (D5S818, D13S317,
D7S820, D16S539, CSF1PO, and Penta D) are displayed in
VI. PCR SETUP AND DETECTION green. The fragments of the prototype ILS-500 size marker are
labeled with CXR and are shown in red. (Taken from Promega pro-
motional literature.) (From Schanfield, M. S. (2000). Deoxyribonu-
The manufacturers of the kits have done forensic vali-
cleic Acid/Polymerase Chain Reaction-Short Tandem Repeats. In
dations of the kits; however, each laboratory is responsi- “Encyclopedia of Forensic Sciences” (Siegel, J. A., Saukko, P. J.,
ble for the individualized validation required before test- and Knupfer, G. C., eds.), Academic Press, London, p. 533.)