Page 238 - Engineering Plastics Handbook
P. 238

204   Engineering Plastics

                           DMA: Log E ′ versus PPE/PA66 ratio
           10 10
                                                           60/40
                                                           50/50
                                                           40/60
                                                           30/70
           10 9                                            20/80
          E ′, Pa                                          0/100
          Log
           10 8


           10 7
              25         75         125        175        225
                                  Temperature, °C
        Figure 9.5 Effect of PPE on storage modulus of PPE/PA66 alloys.


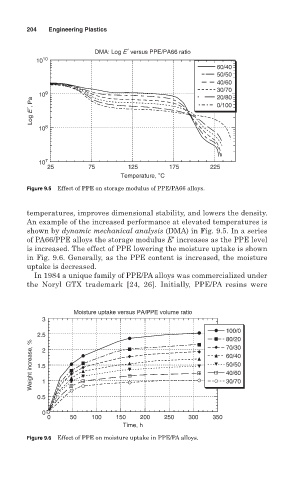
        temperatures, improves dimensional stability, and lowers the density.
        An example of the increased performance at elevated temperatures is
        shown by dynamic mechanical analysis (DMA) in Fig. 9.5. In a series
        of PA66/PPE alloys the storage modulus E′ increases as the PPE level
        is increased. The effect of PPE lowering the moisture uptake is shown
        in Fig. 9.6. Generally, as the PPE content is increased, the moisture
        uptake is decreased.
          In 1984 a unique family of PPE/PA alloys was commercialized under
        the Noryl GTX trademark [24, 26]. Initially, PPE/PA resins were


                     Moisture uptake versus PA/PPE volume ratio
            3
                                                              100/0
           2.5                                                80/20
          Weight increase, %  1.5 2                           60/40
                                                              70/30

                                                              50/50
                                                              40/60


           0.5 1                                              30/70

            0
              0     50    100   150    200   250    300   350
                                  Time, h
        Figure 9.6 Effect of PPE on moisture uptake in PPE/PA alloys.
   233   234   235   236   237   238   239   240   241   242   243