
Page 224 - Enhanced Oil Recovery in Shale and Tight Reservoirs
P. 224
Fluid-rock interactions 207
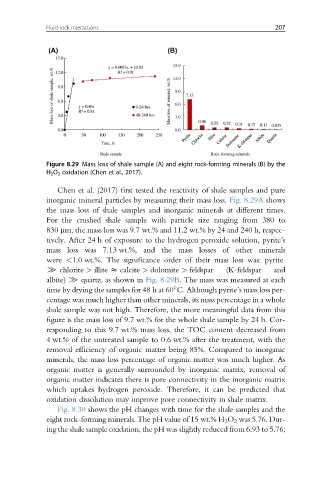
Figure 8.29 Mass loss of shale sample (A) and eight rock-forming minerals (B) by the
H 2 O 2 oxidation (Chen et al., 2017).
Chen et al. (2017) first tested the reactivity of shale samples and pure
inorganic mineral particles by measuring their mass loss. Fig. 8.29A shows
the mass loss of shale samples and inorganic minerals at different times.
For the crushed shale sample with particle size ranging from 380 to
830 mm, the mass loss was 9.7 wt.% and 11.2 wt.% by 24 and 240 h, respec-
tively. After 24 h of exposure to the hydrogen peroxide solution, pyrite’s
mass loss was 7.13 wt.%, and the mass losses of other minerals
were <1.0 wt.%. The significance order of their mass loss was: pyrite
[ chlorite > illite z calcite > dolomite > feldspar (K-feldspar and
albite) [ quartz, as shown in Fig. 8.29B. The mass was measured at each
time by drying the samples for 48 h at 60 C. Although pyrite’s mass loss per-
centage was much higher than other minerals, its mass percentage in a whole
shale sample was not high. Therefore, the more meaningful data from this
figure is the mass loss of 9.7 wt.% for the whole shale sample by 24 h. Cor-
responding to this 9.7 wt.% mass loss, the TOC content decreased from
4 wt.% of the untreated sample to 0.6 wt.% after the treatment, with the
removal efficiency of organic matter being 85%. Compared to inorganic
minerals, the mass loss percentage of organic matter was much higher. As
organic matter is generally surrounded by inorganic matrix, removal of
organic matter indicates there is pore connectivity in the inorganic matrix
which uptakes hydrogen peroxide. Therefore, it can be predicted that
oxidation dissolution may improve pore connectivity in shale matrix.
Fig. 8.30 shows the pH changes with time for the shale samples and the
eight rock-forming minerals. The pH value of 15 wt.% H 2 O 2 was 5.76. Dur-
ing the shale sample oxidation, the pH was slightly reduced from 6.93 to 5.76;