
Page 68 - Entrophy Analysis in Thermal Engineering Systems
P. 68
60 Entropy Analysis in Thermal Engineering Systems
For the Otto cycle, T max ¼T 3 and T min ¼T 1 . So, from the relation
p 1 V 1 p 3 V 3
¼ , one finds PR¼CR T R .
T 1 T 3
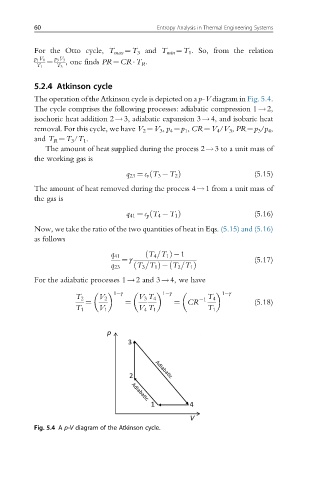
5.2.4 Atkinson cycle
The operation of the Atkinson cycle is depicted on a p-V diagram in Fig. 5.4.
The cycle comprises the following processes: adiabatic compression 1!2,
isochoric heat addition 2!3, adiabatic expansion 3!4, and isobaric heat
removal. For this cycle, we have V 2 ¼V 3 , p 4 ¼p 1 , CR¼V 4 /V 3 , PR¼p 3 /p 4 ,
and T R ¼T 3 /T 1 .
The amount of heat supplied during the process 2!3 to a unit mass of
the working gas is
ð
q 23 ¼ c v T 3 T 2 Þ (5.15)
The amount of heat removed during the process 4!1 from a unit mass of
the gas is
q 41 ¼ c p T 4 T 1 Þ (5.16)
ð
Now, we take the ratio of the two quantities of heat in Eqs. (5.15) and (5.16)
as follows
q 41 ð T 4 =T 1 Þ 1
¼ γ (5.17)
ð
q 23 ð T 3 =T 1 Þ T 2 =T 1 Þ
For the adiabatic processes 1!2 and 3!4, we have
1 γ 1 γ 1 γ
T 2 V 2 V 3 T 4 1 T 4
¼ ¼ ¼ CR (5.18)
T 1 V 1 V 4 T 1 T 1
Fig. 5.4 A p-V diagram of the Atkinson cycle.