
Page 99 - Entrophy Analysis in Thermal Engineering Systems
P. 99
92 Entropy Analysis in Thermal Engineering Systems
γ 1
1 γ CR
ð 1 CR Þ η T R
exp η
_ W net
η ¼ ¼ com (7.27)
_ γ 1 1
CR
Q
H
T R 1
η
com
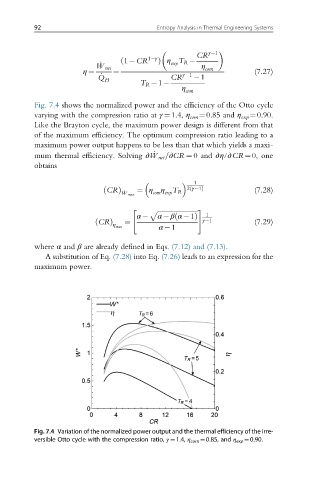
Fig. 7.4 shows the normalized power and the efficiency of the Otto cycle
varying with the compression ratio at γ ¼1.4, η com ¼0.85 and η exp ¼0.90.
Like the Brayton cycle, the maximum power design is different from that
of the maximum efficiency. The optimum compression ratio leading to a
maximum power output happens to be less than that which yields a maxi-
mum thermal efficiency. Solving ∂ _ W net =∂CR ¼ 0 and ∂η/∂CR¼0, one
obtains
1
ð
ð 2 γ 1Þ (7.28)
¼ η η T R
com exp
CRÞ _ W max
" ffiffiffiffiffiffiffiffiffiffiffiffiffiffiffiffiffiffiffiffiffiffiffiffi #
p
1
α α βα 1Þ
ð
ð CRÞ ¼ γ 1 (7.29)
α 1
η max
where α and β are already defined in Eqs. (7.12) and (7.13).
A substitution of Eq. (7.28) into Eq. (7.26) leads to an expression for the
maximum power.
Fig. 7.4 Variation of the normalized power output and the thermal efficiency of the irre-
versible Otto cycle with the compression ratio, γ ¼1.4, η com ¼0.85, and η exp ¼0.90.