
Page 248 - Environmental Nanotechnology Applications and Impacts of Nanomaterials
P. 248
Nanoparticle Transport, Aggregation, and Deposition 233
energy between two surfaces as the sum of Lifshitz-van der Waals (LW)
and electrostatic (EL) interactions. Other forces, defined as non-DLVO
forces, have also been found to be significant for surfaces in aqueous
environments [3, 5] and have thus been included in the form of an
extended DLVO (XDLVO) approach. Here, the total interaction energy
between two surfaces in water may be written as:
XDLVO LW EL AB BO (1)
U 123 5 U 123 1 U 123 1 U 123 1 U 123
where U XDLVO is the total interaction energy between two surfaces
immersed in water; U LW is the Lifshitz-van der Waals interaction term;
U EL is the electrostatic interaction term; U AB is the acid-base interac-
tion term; and U BO is the interaction energy due to Born repulsion. The
subscripts 1, 2, and 3 correspond to surfaces 1 and 3 separated by an
aqueous medium 2. Other interactions, such as steric interactions, are
also likely and should be considered, though they are not included in the
energy balance presented here. Steric interactions generally result from
the adsorption of polymers or other long-chained molecules and can act
to either stabilize or destabilize a particle suspension. This topic is
addressed later in this chapter.
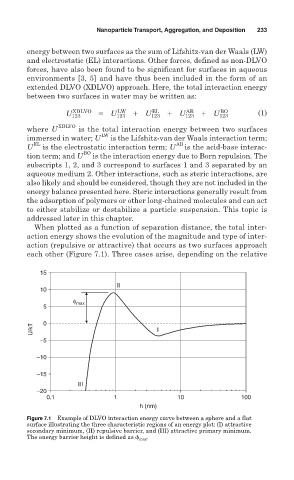
When plotted as a function of separation distance, the total inter-
action energy shows the evolution of the magnitude and type of inter-
action (repulsive or attractive) that occurs as two surfaces approach
each other (Figure 7.1). Three cases arise, depending on the relative
15
II
10
φ max
5
U/kT 0 I
–5
–10
–15
III
–20
0.1 1 10 100
h (nm)
Figure 7.1 Example of DLVO interaction energy curve between a sphere and a flat
surface illustrating the three characteristic regions of an energy plot: (I) attractive
secondary minimum, (II) repulsive barrier, and (III) attractive primary minimum.
The energy barrier height is defined as max .