
Page 151 - Essentials of physical chemistry
P. 151
Gibbs’ Free Energy and Equilibria 113
Liquid
Liquid
Pressure melt
Pressure (torr) Solid Pressure (torr) Solid
Gas
Gas
(a) Temperature (°C) (b) Temperature (°C)
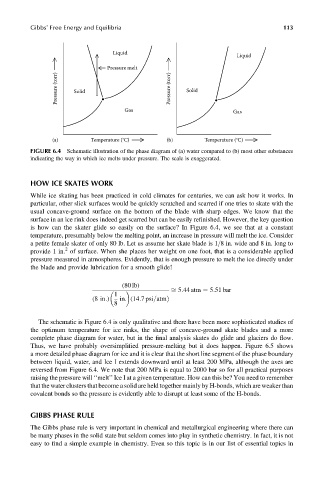
FIGURE 6.4 Schematic illustration of the phase diagram of (a) water compared to (b) most other substances
indicating the way in which ice melts under pressure. The scale is exaggerated.
HOW ICE SKATES WORK
While ice skating has been practiced in cold climates for centuries, we can ask how it works. In
particular, other slick surfaces would be quickly scratched and scarred if one tries to skate with the
usual concave-ground surface on the bottom of the blade with sharp edges. We know that the
surface in an ice rink does indeed get scarred but can be easily refinished. However, the key question
is how can the skater glide so easily on the surface? In Figure 6.4, we see that at a constant
temperature, presumably below the melting point, an increase in pressure will melt the ice. Consider
a petite female skater of only 80 lb. Let us assume her skate blade is 1=8 in. wide and 8 in. long to
2
provide 1 in. of surface. When she places her weight on one foot, that is a considerable applied
pressure measured in atmospheres. Evidently, that is enough pressure to melt the ice directly under
the blade and provide lubrication for a smooth glide!
(80 lb)
ffi 5:44 atm ¼ 5:51 bar
1
(8 in:) in: (14:7 psi=atmÞ
8
The schematic is Figure 6.4 is only qualitative and there have been more sophisticated studies of
the optimum temperature for ice rinks, the shape of concave-ground skate blades and a more
complete phase diagram for water, but in the final analysis skates do glide and glaciers do flow.
Thus, we have probably oversimplified pressure-melting but it does happen. Figure 6.5 shows
a more detailed phase diagram for ice and it is clear that the short line segment of the phase boundary
between liquid, water, and Ice I extends downward until at least 200 MPa, although the axes are
reversed from Figure 6.4. We note that 200 MPa is equal to 2000 bar so for all practical purposes
raising the pressure will ‘‘melt’’ Ice I at a given temperature. How can this be? You need to remember
that the water clusters that become a solid are held together mainly by H-bonds, which are weaker than
covalent bonds so the pressure is evidently able to disrupt at least some of the H-bonds.
GIBBS PHASE RULE
The Gibbs phase rule is very important in chemical and metallurgical engineering where there can
be many phases in the solid state but seldom comes into play in synthetic chemistry. In fact, it is not
easy to find a simple example in chemistry. Even so this topic is in our list of essential topics in