
Page 152 - Essentials of physical chemistry
P. 152
114 Essentials of Physical Chemistry
200
150
Liquid
VII
100
50
T/°C
VI
0
V VIII
III
I
–50
II
–100
–150
0 500 1000 1500 2000 2500 3000 3500
P/MPa
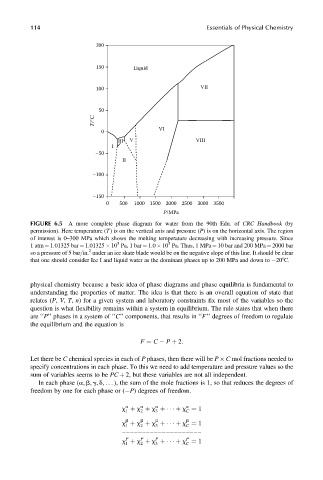
FIGURE 6.5 A more complete phase diagram for water from the 90th Edn. of CRC Handbook (by
permission). Here temperature (T) is on the vertical axis and pressure (P) is on the horizontal axis. The region
of interest is 0–300 MPa which shows the melting temperature decreasing with increasing pressure. Since
5
5
1 atm ¼ 1.01325 bar ¼ 1.01325 10 Pa, 1 bar ¼ 1.0 10 Pa. Thus, 1 MPa ¼ 10 bar and 200 MPa ¼ 2000 bar
2
so a pressure of 5 bar=in. under an ice skate blade would be on the negative slope of this line. It should be clear
that one should consider Ice I and liquid water as the dominant phases up to 200 MPa and down to 208C.
physical chemistry because a basic idea of phase diagrams and phase equilibria is fundamental to
understanding the properties of matter. The idea is that there is an overall equation of state that
relates (P, V, T, n) for a given system and laboratory constraints fix most of the variables so the
question is what flexibility remains within a system in equilibrium. The rule states that when there
are ‘‘P’’ phases in a system of ‘‘C’’ components, that results in ‘‘F’’ degrees of freedom to regulate
the equilibrium and the equation is
F ¼ C P þ 2:
Let there be C chemical species in each of P phases, then there will be P C mol fractions needed to
specify concentrations in each phase. To this we need to add temperature and pressure values so the
sum of variables seems to be PC þ 2, but these variables are not all independent.
In each phase (a, b, g, d, .. . ), the sum of the mole fractions is 1, so that reduces the degrees of
freedom by one for each phase or ( P) degrees of freedom.
a a a a
x þ x þ x þ þ x ¼ 1
1 2 3 C
b
b
b
b
x þ x þ x þ þ x ¼ 1
3
C
2
1
____________________
P
P
P
P
x þ x þ x þ þ x ¼ 1
1 2 3 C