Page 211 - Essentials of physical chemistry
P. 211

More Kinetics and Some Mechanisms                                           173


                       0.1
                      0.09
                      0.08
                    Rate, mM/s 0.07
                      0.06
                      0.05
                      0.04
                      0.03
                      0.02
                      0.01
                        0
                         0        0.02     0.04      0.06     0.08      0.1      0.12
                                                   [S], mol/L
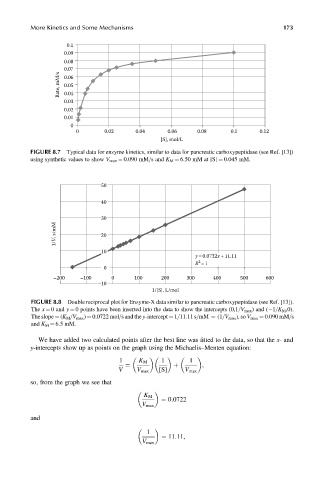
            FIGURE 8.7  Typical data for enzyme kinetics, similar to data for pancreatic carboxypeptidase (see Ref. [13])
            using synthetic values to show V max ¼ 0.090 mM=s and K M ¼ 6.50 mM at [S] ¼ 0.045 mM.


                                 50

                                 40

                                 30
                   1/V, s/mM     20


                                 10
                                                             y =0.0722x +11.11
                                                              2
                                                             R =1
                                  0
                   –200    –100     0      100     200     300     400     500    600
                                –10
                                                1/[S], L/mol
            FIGURE 8.8 Double reciprocal plot for Enzyme-X data similar to pancreatic carboxypeptidase (see Ref. [13]).
            The x ¼ 0 and y ¼ 0 points have been inserted into the data to show the intercepts (0,1=V max ) and ( 1=K M ,0).
            The slope ¼ (K M =V max ) ¼ 0.0722 mol=s and the y-intercept ¼ 1=11.11 s=mM ¼ (1=V max ), so V max ¼ 0.090 mM=s
            and K M ¼ 6.5 mM.

              We have added two calculated points after the best line was fitted to the data, so that the x- and
            y-intercepts show up as points on the graph using the Michaelis–Menten equation:

                                      1     K M    1        1
                                                               ,
                                                       þ
                                      V     V max  [S]    V max
                                        ¼
            so, from the graph we see that

                                              K M
                                                   ¼ 0:0722
                                             V max
            and

                                               1
                                                   ¼ 11:11,
                                             V max
   206   207   208   209   210   211   212   213   214   215   216