
Page 139 - Excel Data Analysis
P. 139
08 537547 Ch07.qxd 3/4/03 12:07 PM Page 125
WORKING WITH PIVOTTABLE REPORTS 7
When you create or view a PivotTable, Excel You can use the Page field, on the
displays the PivotTable toolbar. The following table top left corner of the PivotTable, to
describes the most important toolbar buttons: help filter data from a large list.
This field breaks the report
BUTTON DESCRIPTION into separate pages and only
Displays the AutoFormat dialog box. displays records that meet your
See Chapter 1 for more information. specifications. You can view either
all values or a specific value. See
Creates a PivotChart using the
default Pivot Chart format. the section "Filter a Field" for more
on working with the Page field.
Hides the items in a group. See the
section "Group PivotTable Data Although you can change the
Items" for more information. layout of a PivotTable, you cannot
Shows all hidden items in the add or remove rows or columns, or
PivotTable report. modify cell values on a PivotTable
report. To change a value in a
Updates the PivotTable report with
the current data values. PivotTable cell you must make
modifications to the source data.
Hides or reveals the PivotTable Field
List.
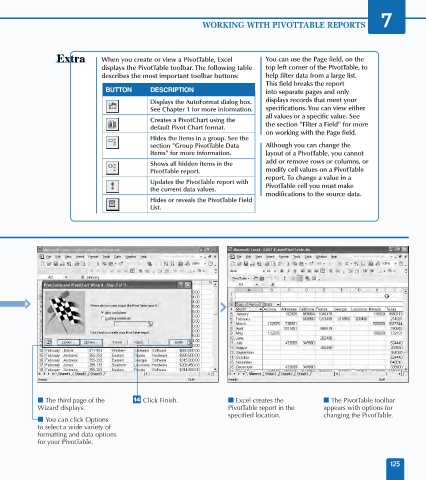
■ The third page of the ™ Click Finish. ■ Excel creates the ■ The PivotTable toolbar
Wizard displays. PivotTable report in the appears with options for
specified location. changing the PivotTable.
■ You can click Options
to select a wide variety of
formatting and data options
for your PivotTable.
125