
Page 138 - Excel Data Analysis
P. 138
08 537547 Ch07.qxd 3/4/03 12:07 PM Page 124
EXCEL DATA ANALYSIS
CREATE A PIVOTTABLE REPORT FROM
AN EXCEL LIST (CONTINUED)
ou build your PivotTable report by dragging the You can place multiple field buttons in the same section on
appropriate column names and fields to a diagram the diagram. For example, if you place the Month field
Y until you have your desired layout. The column button in the Row section followed by the Sales Person
names and fields appear as field buttons, which you can use field button, Excel displays the amounts for each month
in any combination. If you do not include a field button on broken down into Sales Person sub-categories. You can also
the layout, the corresponding data values do not display on specify a value that all data records must contain by
the PivotTable report. dragging a field button to the Page section. For example, if
the Page area contains the State field button, only data
Any buttons that you drag to the Row area of the diagram from the selected state appears in the PivotTable. See the
appear on the PivotTable as separate rows. Any buttons in section "PivotTable Basics" for more on the elements of a
the Column area become columns. When you drag a field PivotTable.
button to the Data area, by default the wizard applies the
Sum function if the values are numeric. If the values that After you create the PivotTable, you can quickly change the
correspond to the field button are not numeric, the wizard layout by dragging fields from one section of the PivotTable
automatically applies the Count function. If you want to report to another. See the section "Change the Layout of a
summarize the data differently, you can select a different PivotTable" for more information.
Excel function. See the section "Change the Calculation of a
Data Field" for information on applying a different
summarization function.
CREATE A PIVOTTABLE REPORT FROM AN EXCEL LIST (CONTINUED)
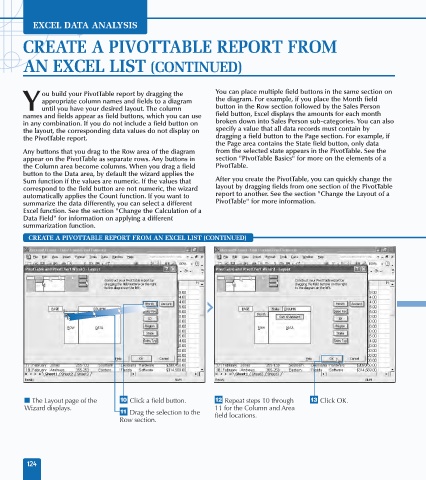
■ The Layout page of the ‚ Click a field button. ± Repeat steps 10 through ¡ Click OK.
Wizard displays. 11 for the Column and Area
— Drag the selection to the field locations.
Row section.
124