
Page 140 - Excel Data Analysis
P. 140
08 537547 Ch07.qxd 3/4/03 12:07 PM Page 126
EXCEL DATA ANALYSIS
CHANGE THE LAYOUT OF A PIVOTTABLE
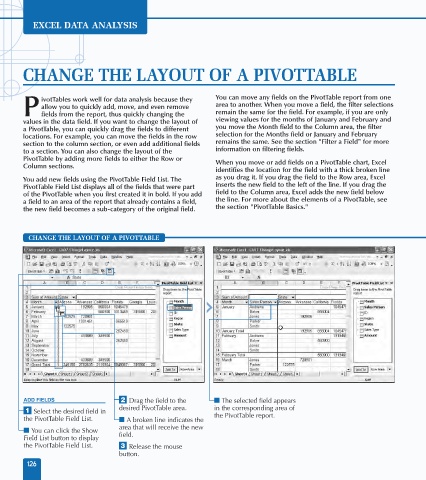
ivotTables work well for data analysis because they You can move any fields on the PivotTable report from one
allow you to quickly add, move, and even remove area to another. When you move a field, the filter selections
P fields from the report, thus quickly changing the remain the same for the field. For example, if you are only
values in the data field. If you want to change the layout of viewing values for the months of January and February and
a PivotTable, you can quickly drag the fields to different you move the Month field to the Column area, the filter
locations. For example, you can move the fields in the row selection for the Months field or January and February
section to the column section, or even add additional fields remains the same. See the section "Filter a Field" for more
to a section. You can also change the layout of the information on filtering fields.
PivotTable by adding more fields to either the Row or When you move or add fields on a PivotTable chart, Excel
Column sections.
identifies the location for the field with a thick broken line
You add new fields using the PivotTable Field List. The as you drag it. If you drag the field to the Row area, Excel
PivotTable Field List displays all of the fields that were part inserts the new field to the left of the line. If you drag the
of the PivotTable when you first created it in bold. If you add field to the Column area, Excel adds the new field below
a field to an area of the report that already contains a field, the line. For more about the elements of a PivotTable, see
the new field becomes a sub-category of the original field. the section "PivotTable Basics."
CHANGE THE LAYOUT OF A PIVOTTABLE
Sales Person
ADD FIELDS ¤ Drag the field to the ■ The selected field appears
desired PivotTable area. in the corresponding area of
⁄ Select the desired field in
the PivotTable Field List. ■ A broken line indicates the the PivotTable report.
area that will receive the new
■ You can click the Show
Field List button to display field.
the PivotTable Field List. ‹ Release the mouse
button.
126