
Page 167 - Excel Data Analysis
P. 167
09 537547 Ch08.qxd 3/4/03 12:06 PM Page 153
CREATING PIVOTCHARTS 8
If you want to group fields that do not contain When grouping together dates and times, you can
numeric, date, or time values, you can do so use multiple groupings. For example, you can create
using the associated PivotTable report. Click the a Months grouping and a Quarters grouping. To use
tab of the PivotTable report. On the PivotTable, multiple groupings, click each desired grouping in
click the items in the field that you want to group the By list in the Grouping dialog box. As you click
together and then click Data ➪ Group and each grouping selection, Excel highlights it in the list.
Outline ➪ Group. When you switch back to the
PivotChart, Excel groups the items together. Keep If you want to remove all groupings from a field,
in mind that you do not need to have adjacent click Data ➪ Group and Outline ➪ Ungroup. Excel
items to select them. See Chapter 1 to select removes the groupings. The original data that you
items and Chapter 7 for more information on used to generate the PivotChart field items appears
grouping items from a PivotTable. on the PivotChart.
<1/1/2002
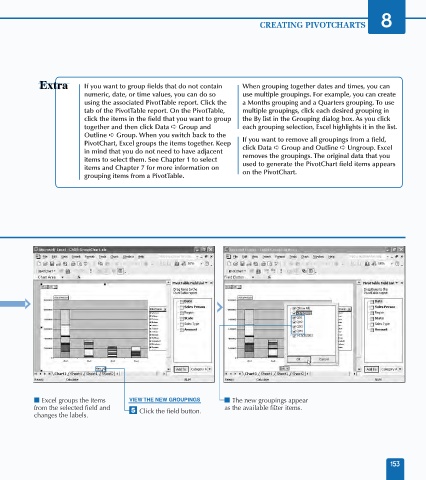
■ Excel groups the items VIEW THE NEW GROUPINGS ■ The new groupings appear
from the selected field and ˇ Click the field button. as the available filter items.
changes the labels.
153