
Page 166 - Excel Data Analysis
P. 166
09 537547 Ch08.qxd 3/4/03 12:06 PM Page 152
EXCEL DATA ANALYSIS
GROUP ITEMS IN A PIVOTCHART FIELD
f your PivotChart contains a lot of different data values, Series fields. If you attempt to group another type of data
you may find it confusing to interpret all the information on the PivotChart, Excel displays an error message.
I as part of your data analysis process. Instead of In the Grouping dialog box, you must indicate where you
eliminating values from the chart by filtering, you can create want to start and end the grouping as well as how to group
smaller groups of items on the PivotChart. You group the data. For example, if you group a field that contains
specific items to illustrate their relationship on the dates, you must specify the first date to group, the last date
PivotChart, thus reducing the number of displayed data to group, and whether to group the dates by day, month,
items. For example, if you have a Date field on the quarter, or year.
Categories axis, with specific dates as the items, you can
group the dates together by month or quarter. See the When you create a group, Excel changes the corresponding
section "Filter a PivotChart Field" for more information on Series or Categories label to represent the group. If you
filtering, and "Create a PivotChart from an External attempt to filter the PivotChart, the new groups display as
Database" for more on available fields. the filter items in place of the original items. For example, if
you combine the dates 1/15/2002, 1/20/2002, and 1/25/2002
You can group only items that contain numeric values, into a Month group, Excel displays the Month group as the
dates, or times directly on a PivotChart. And you can group label and places the individual items in the filter box.
only the fields that are part of either the Categories or
GROUP ITEMS IN A PIVOTCHART FIELD
Quarters
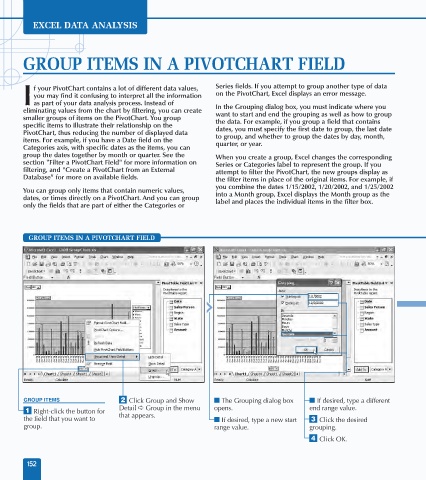
GROUP ITEMS ¤ Click Group and Show ■ The Grouping dialog box ■ If desired, type a different
Detail ➪ Group in the menu opens. end range value.
⁄ Right-click the button for
the field that you want to that appears. ■ If desired, type a new start ‹ Click the desired
group. range value. grouping.
› Click OK.
152