
Page 62 - Excel Data Analysis
P. 62
04 537547 Ch03.qxd 3/4/03 11:50 AM Page 48
EXCEL DATA ANALYSIS
FILTER A LIST
hen analyzing large data lists, limiting exactly what reveals a menu of all the unique values within that column.
information displays in your worksheet is often If you select one of the values, Excel displays all the records
W necessary. In Excel, this limiting process is referred that contain that value and hides the other records. To filter
to as filtering. You can filter your list of data records with the by multiple column values, you filter the first column and
AutoFilter command so that only the records that match then select a different value in a second column.
specific criteria display in the worksheet. Each worksheet Excel places three filter options at the top of each menu. The
row is treated as a separate record. For example, if you have (All) option allows you to undo a filter and redisplay the
a list of monthly sales from different regions, you can filter records that are currently hidden by the filter. You use
the list to display only the sales within the Western region. the other two options, (Top 10) and (Custom), to further
When you apply a filter, Excel simply hides the records that customize the filter. The (Top 10) option filter lets you view
do not match the specified filter criteria.
the ten highest or ten lowest records. The customize filter
When you select the AutoFilter option, Excel examines the lets you view specific rows within one column using custom
values in each column, applies your filter criteria, and places filter definitions. See the section "Create a Custom Filter" for
arrow buttons at the top of each column of data. Excel more information about the (Custom) option.
identifies the columns with filters by changing the color of
the arrow on the button from black to blue. The arrow
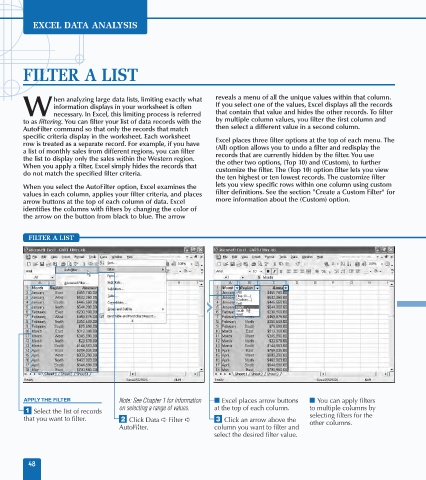
FILTER A LIST
North
APPLY THE FILTER Note: See Chapter 1 for information ■ Excel places arrow buttons ■ You can apply filters
on selecting a range of values. at the top of each column. to multiple columns by
⁄ Select the list of records
that you want to filter. ¤ Click Data ➪ Filter ➪ ‹ Click an arrow above the selecting filters for the
other columns.
AutoFilter. column you want to filter and
select the desired filter value.
48