
Page 257 - Excel Progamming Weekend Crash Course
P. 257
n540629 ch18.qxd 9/2/03 9:35 AM Page 232
232 Saturday Evening
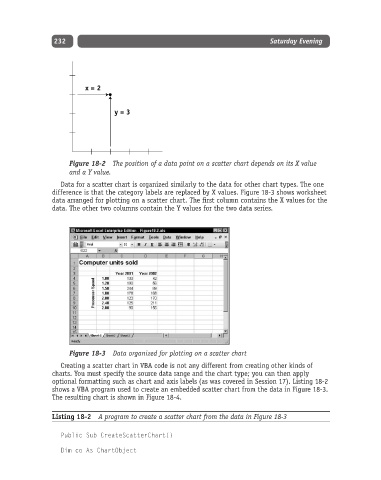
x = 2
y = 3
Figure 18-2 The position of a data point on a scatter chart depends on its X value
and a Y value.
Data for a scatter chart is organized similarly to the data for other chart types. The one
difference is that the category labels are replaced by X values. Figure 18-3 shows worksheet
data arranged for plotting on a scatter chart. The first column contains the X values for the
data. The other two columns contain the Y values for the two data series.
Figure 18-3 Data organized for plotting on a scatter chart
Creating a scatter chart in VBA code is not any different from creating other kinds of
charts. You must specify the source data range and the chart type; you can then apply
optional formatting such as chart and axis labels (as was covered in Session 17). Listing 18-2
shows a VBA program used to create an embedded scatter chart from the data in Figure 18-3.
The resulting chart is shown in Figure 18-4.
Listing 18-2 A program to create a scatter chart from the data in Figure 18-3
Public Sub CreateScatterChart()
Dim co As ChartObject