
Page 260 - Excel Progamming Weekend Crash Course
P. 260
n540629 ch18.qxd 9/2/03 9:35 AM Page 235
Session 18 — Advanced Charting Techniques 235
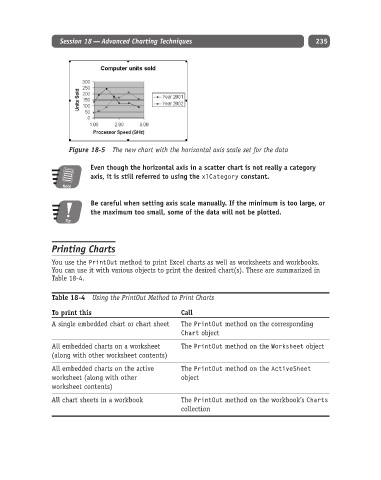
Figure 18-5 The new chart with the horizontal axis scale set for the data
Even though the horizontal axis in a scatter chart is not really a category
axis, it is still referred to using the xlCategory constant.
Note
Be careful when setting axis scale manually. If the minimum is too large, or
the maximum too small, some of the data will not be plotted.
Tip
Printing Charts
You use the PrintOut method to print Excel charts as well as worksheets and workbooks.
You can use it with various objects to print the desired chart(s). These are summarized in
Table 18-4.
Table 18-4 Using the PrintOut Method to Print Charts
To print this Call
A single embedded chart or chart sheet The PrintOut method on the corresponding
Chart object
All embedded charts on a worksheet The PrintOut method on the Worksheet object
(along with other worksheet contents)
All embedded charts on the active The PrintOut method on the ActiveSheet
worksheet (along with other object
worksheet contents)
All chart sheets in a workbook The PrintOut method on the workbook’s Charts
collection