Page 189 - Excel Workbook for Dummies
P. 189

20_798452 ch14.qxp  3/13/06  7:49 PM  Page 172
                172       Part III: Working with Graphics

                                                          Value axis            Data series
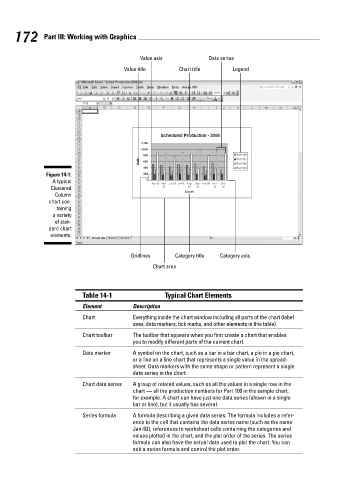
                                                    Value title       Chart title       Legend


                           Figure 14-1:
                             A typical
                            Clustered
                              Column
                            chart con-
                              taining
                             a variety
                              of stan-
                            dard chart
                            elements.


                                                       Gridlines     Category title  Category axis
                                                              Chart area


                                       Table 14-1                 Typical Chart Elements
                                       Element         Description

                                       Chart           Everything inside the chart window including all parts of the chart (label
                                                       axes, data markers, tick marks, and other elements in this table).
                                       Chart toolbar   The toolbar that appears when you first create a chart that enables
                                                       you to modify different parts of the current chart.

                                       Data marker     A symbol on the chart, such as a bar in a bar chart, a pie in a pie chart,
                                                       or a line on a line chart that represents a single value in the spread-
                                                       sheet. Data markers with the same shape or pattern represent a single
                                                       data series in the chart.
                                       Chart data series  A group of related values, such as all the values in a single row in the
                                                       chart — all the production numbers for Part 100 in the sample chart,
                                                       for example. A chart can have just one data series (shown in a single
                                                       bar or line), but it usually has several.

                                       Series formula  A formula describing a given data series. The formula includes a refer-
                                                       ence to the cell that contains the data series name (such as the name
                                                       Jan-92), references to worksheet cells containing the categories and
                                                       values plotted in the chart, and the plot order of the series. The series
                                                       formula can also have the actual data used to plot the chart. You can
                                                       edit a series formula and control the plot order.
   184   185   186   187   188   189   190   191   192   193   194