
Page 191 - Excel Workbook for Dummies
P. 191
20_798452 ch14.qxp 3/13/06 7:49 PM Page 174
174 Part III: Working with Graphics
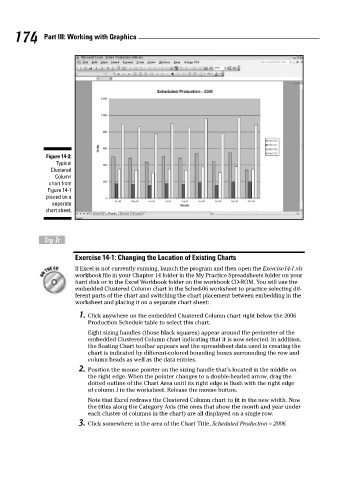
Figure 14-2:
Typical
Clustered
Column
chart from
Figure 14-1
placed on a
separate
chart sheet.
Try It
Exercise 14-1: Changing the Location of Existing Charts
If Excel is not currently running, launch the program and then open the Exercise14-1.xls
workbook file in your Chapter 14 folder in the My Practice Spreadsheets folder on your
hard disk or in the Excel Workbook folder on the workbook CD-ROM. You will use the
embedded Clustered Column chart in the Sched-06 worksheet to practice selecting dif-
ferent parts of the chart and switching the chart placement between embedding in the
worksheet and placing it on a separate chart sheet:
1. Click anywhere on the embedded Clustered Column chart right below the 2006
Production Schedule table to select this chart.
Eight sizing handles (those black squares) appear around the perimeter of the
embedded Clustered Column chart indicating that it is now selected. In addition,
the floating Chart toolbar appears and the spreadsheet data used in creating the
chart is indicated by different-colored bounding boxes surrounding the row and
column heads as well as the data entries.
2. Position the mouse pointer on the sizing handle that’s located in the middle on
the right edge. When the pointer changes to a double-headed arrow, drag the
dotted outline of the Chart Area until its right edge is flush with the right edge
of column J in the worksheet. Release the mouse button.
Note that Excel redraws the Clustered Column chart to fit in the new width. Now
the titles along the Category Axis (the ones that show the month and year under
each cluster of columns in the chart) are all displayed on a single row.
3. Click somewhere in the area of the Chart Title, Scheduled Production – 2006.